


Understanding the Tax Treatment of Non-Qualified Stock Options (NSOs)
The Tax Treatment of NSO: Understanding the Basics Non-Qualified Stock Options (NSOs) are a type of stock option that is more commonly offered to …
Read Article
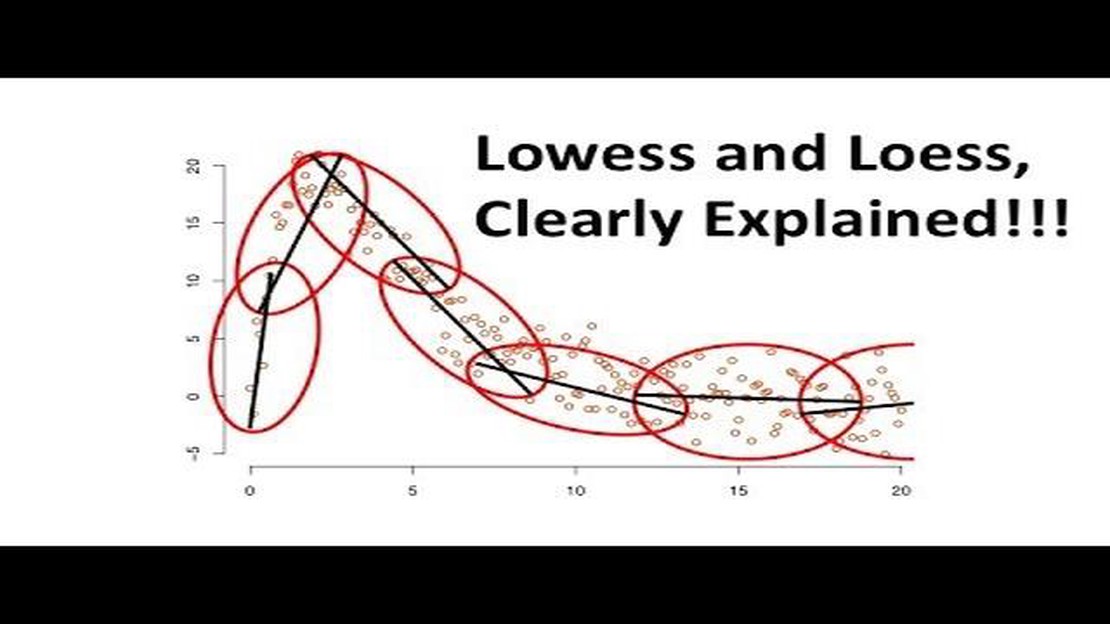
When it comes to analyzing data and identifying trends, statisticians have developed a range of techniques. One such technique is the Lowess method, a non-parametric regression method used for smoothing scatterplots and estimating trends. The Lowess method, short for “locally weighted scatterplot smoothing,” is particularly useful for datasets with noisy and non-linear patterns.
First introduced by William Cleveland in 1979, the Lowess method has gained widespread popularity due to its effectiveness in capturing the underlying structure of data. Unlike traditional regression models, which may assume a specific functional form, the Lowess method is flexible and adapts to the local behavior of the data. By fitting a series of regression models over neighboring subsets of the data, the Lowess method provides a smooth estimate that emphasizes the local trend.
One of the major advantages of the Lowess method is its ability to handle outliers and robustly estimate the trend. The method achieves this by assigning larger weights to data points closer to the point being estimated and smaller weights to data points that are farther away. This adaptive weighting scheme ensures that outliers have minimal impact on the final estimate, making the Lowess method robust to extreme values. Additionally, the Lowess method allows users to control the level of smoothing applied, providing a balance between capturing fine details and removing noise.
The Lowess method is widely used in various fields, including finance, environmental sciences, and economics, to name a few. It has been instrumental in uncovering hidden patterns and relationships in complex datasets. By understanding the underlying principles and assumptions of the Lowess method, researchers and data analysts can make informed decisions when applying this technique to their own datasets.
In this comprehensive guide, we will explore the Lowess method in detail. We will delve into the mathematical formulation and the underlying assumptions of the method. We will also discuss practical considerations, such as choosing appropriate tuning parameters and assessing the quality of the fit. Additionally, we will provide step-by-step examples illustrating how to implement the Lowess method using popular statistical software. By the end of this guide, readers will have a solid understanding of the Lowess method and its applications, empowering them to effectively analyze and interpret data.
The Lowess method, short for “locally weighted scatterplot smoothing”, is a non-parametric regression technique used to fit a smooth curve to a scatterplot of data. It is commonly used for exploratory data analysis to identify trends and patterns in noisy datasets.

The method works by fitting a weighted regression model to each point in the scatterplot, where the weights are assigned based on the distance of the point from the point of interest. This allows the method to capture local trends in the data, while reducing the influence of outliers and noise.
The Lowess method uses a kernel function to assign weights to each point, with the weights declining as the distance from the point of interest increases. The choice of kernel function and the bandwidth parameter determine the smoothness of the resulting curve.
Read Also: Today's JN Bank Exchange Rate: Find Out Rates Online
One of the advantages of the Lowess method is its ability to capture non-linear relationships and non-monotonic trends in the data. This makes it particularly useful for exploring complex datasets and identifying hidden patterns.
However, it is important to note that the Lowess method is a local regression technique, meaning that it only considers nearby points when fitting the curve. This can result in the loss of global information and may not be appropriate for all types of datasets.
In summary, the Lowess method is a powerful tool for exploratory data analysis, allowing for the identification of trends and patterns in noisy datasets. By fitting a smooth curve to a scatterplot of data, it can reveal hidden relationships and provide insights into the underlying structure of the data.
The Lowess method, also known as Locally Weighted Scatterplot Smoothing, is a non-parametric regression technique used to estimate a smooth curve that represents the underlying relationship between two variables. It is especially useful when the relationship between the variables is complex or non-linear.
The Lowess method works by dividing the dataset into smaller subsets or windows and fitting a regression model to each subset. For each data point in a subset, the method assigns a weight based on its distance to the point being estimated. The closer the point, the higher the weight. The weights are then used to fit a regression model, typically a weighted linear regression, to the subset. This allows the method to capture local trends in the data.
The Lowess method calculates a weighted average of the local regression models for all data points, resulting in a smoothed curve that represents the overall relationship between the variables. The degree of smoothing is controlled by a parameter called the “span” or “bandwidth”. A larger span value will result in a smoother curve, while a smaller span value will give more emphasis to local fluctuations.
Read Also: What is the full form of TFP in banking? | Definitions and explanations
One of the advantages of the Lowess method is its robustness to outliers. Since the method uses a local approach, outliers in one region will have less influence on the estimation of the curve in other regions. This makes it particularly useful when dealing with noisy or contaminated data.
In summary, the Lowess method is a powerful tool for exploring and visualizing the relationship between two variables. It provides a flexible and robust way to estimate a smooth curve that captures local trends in the data.

The Lowess (locally weighted scatterplot smoothing) method is a non-parametric regression technique used to fit a smooth curve to a scatterplot of data. It is particularly useful for identifying patterns and trends in noisy data.
The Lowess method works by dividing the data into overlapping subsets and fitting a weighted regression line to each subset. The weights are chosen based on the distance between each data point and the point being fitted. The final smooth curve is obtained by averaging the regression lines at each point.
The Lowess method is particularly useful when you have data with a lot of noise and want to identify underlying trends. It can be used for exploratory data analysis, outlier detection, and data smoothing. However, it may not be suitable if you are looking for a specific functional form for your data.
The Lowess method has several advantages. It is able to fit complex curves to noisy data without making strong assumptions about the underlying function. It is also robust to outliers and can be used with both continuous and categorical predictors. Additionally, the flexibility of the method allows users to control the amount of smoothing applied.
Yes, there are some limitations to the Lowess method. First, it can be computationally intensive, especially for large datasets. Second, the choice of the bandwidth parameter can have a significant impact on the resulting smooth curve. Lastly, the Lowess method may not perform well with data that has sharp changes in the relationship between the predictors and response variable.

The Tax Treatment of NSO: Understanding the Basics Non-Qualified Stock Options (NSOs) are a type of stock option that is more commonly offered to …
Read Article
Understanding the Early Exercise 83b ISO When it comes to employee stock options, one strategy that is often overlooked, but can have significant tax …
Read Article
How to Trade Options on the FTSE This comprehensive guide will provide you with all the information you need to successfully trade options in FTSE. …
Read Article
Trading Hours for HK Options The Hong Kong Options Exchange is one of the most important financial institutions in Asia. Known for its robust and …
Read Article
The tradability of NDX Are you interested in trading NDX but don’t know where to start? Look no further! In this comprehensive guide, we will take you …
Read Article
Can you earn dividends on options? Options are a popular investment vehicle that allows traders to speculate on the price movement of an underlying …
Read Article


