
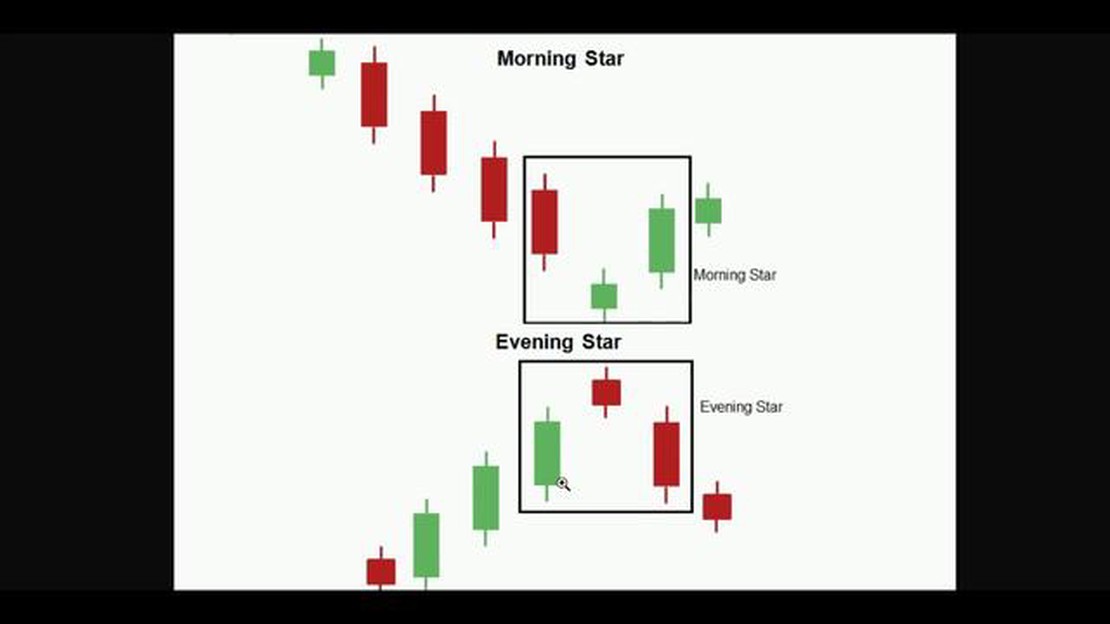

Understanding Morning Star vs Evening Star Forex Candlestick Patterns
Understanding Morning Star and Evening Star Forex Patterns Forex candlestick patterns are a popular tool used by traders to forecast market movements. …
Read Article
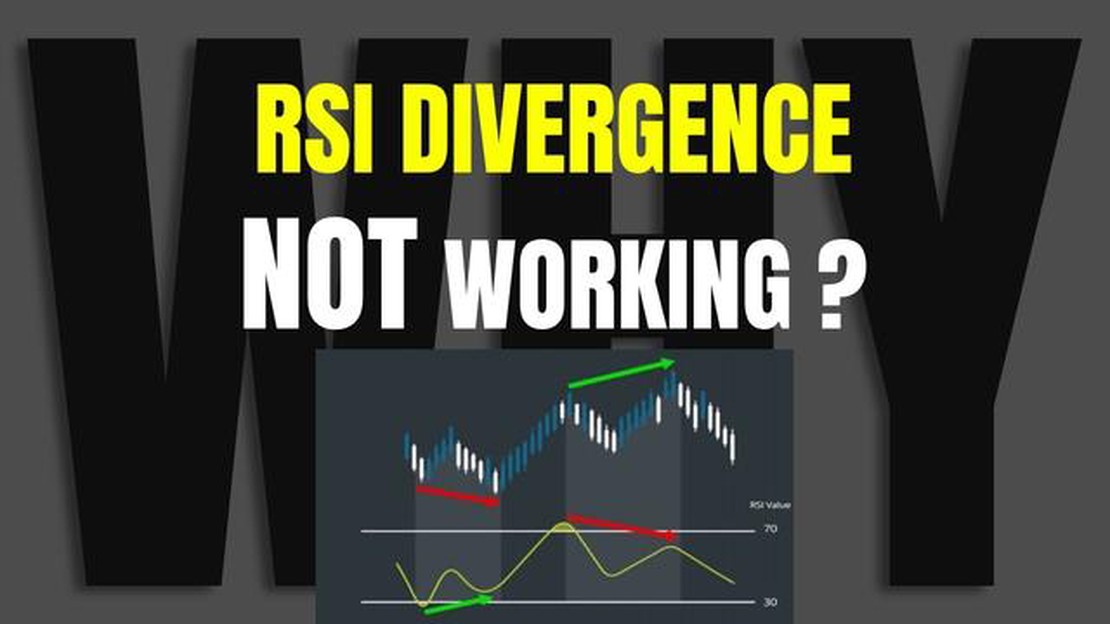
The Relative Strength Index (RSI) is a popular technical indicator used by traders and analysts to identify potential market reversals and overbought/oversold conditions. RSI divergence is a commonly employed strategy that involves comparing the movements of the RSI indicator with the price action of a security to identify bullish or bearish signals. However, there has been a debate among market participants about the effectiveness of RSI divergence as a standalone trading strategy.
Proponents of RSI divergence argue that it can be a powerful tool for identifying trend reversals and generating profitable trade setups. They believe that when the RSI indicator diverges from the price action, it indicates a potential shift in momentum and can be used to predict future price movements. This strategy involves looking for instances where the RSI is making higher or lower highs or lows while the price is moving in the opposite direction, suggesting that the current trend may be losing strength.
On the other hand, skeptics argue that RSI divergence is a flawed strategy that often leads to false or misleading signals. They claim that markets are complex and dynamic, making it difficult to rely solely on the RSI indicator for accurate predictions. They argue that divergences can occur frequently and don’t always result in significant price reversals. Additionally, they point out that the RSI is a lagging indicator that relies on past price data, which may not accurately reflect future market conditions.
Overall, the effectiveness of RSI divergence as a trading strategy depends on various factors, including the market being traded, the time frame being analyzed, and the trader’s skill and experience. While some traders have found success using RSI divergence, others have struggled to achieve consistent profitability. It is important for traders to understand the limitations and potential pitfalls of this strategy and to use it in conjunction with other technical and fundamental analysis tools to make well-informed trading decisions.
RSI divergence is a powerful tool that traders use to identify potential trend reversals and confirm the strength of a trend. It is based on the concept that when the price of an asset and its corresponding RSI indicator move in opposite directions, it could be a sign that the current trend is weakening or about to reverse.

One of the main reasons why RSI divergence is important is because it helps traders to anticipate potential turning points in the market. By identifying divergences between the price and the RSI, traders can gain insight into the market sentiment and possible shifts in supply and demand.
Another significance of RSI divergence is its ability to provide confirmation for trade setups. Traders often use RSI indicators in combination with other technical analysis tools, such as trend lines or support and resistance levels. When these tools align with a divergence pattern on the RSI, it adds an extra layer of confirmation to the trade setup.
Moreover, RSI divergence can also act as a warning sign for potential trend continuation or trend failure. If the price is making new highs or lows, but the corresponding RSI is not confirming those price movements, it could indicate a weakening trend. Traders can use this information to adjust their trading strategies and take advantage of potential market reversals.
It is worth noting that while RSI divergence is a powerful tool, it should not be used in isolation. Traders should always consider multiple factors and use it in conjunction with other technical indicators and analysis methods to make informed trading decisions.
In conclusion, RSI divergence plays a crucial role in technical analysis and can provide valuable insights into market trends and potential reversals. Traders who understand and effectively use RSI divergence as part of their trading strategies can increase their chances of making profitable trades and minimizing risks.
Read Also: Check the Latest Dirham to Pakistan Rupee Exchange Rate Today
The Relative Strength Index (RSI) is a popular technical indicator used in trading to identify overbought and oversold conditions in the market. It was developed by J. Welles Wilder Jr. and is based on the concept of momentum.
The RSI indicator measures the strength and speed of a price movement by comparing the magnitude of recent gains and losses over a specified time period. It oscillates between 0 and 100, with readings above 70 indicating overbought conditions and readings below 30 indicating oversold conditions.
Traders use the RSI indicator to identify potential reversal points in the market. When the RSI is in overbought territory, it suggests that the price may be due for a correction or a downward trend. Conversely, when the RSI is in oversold territory, it suggests that the price may be due for a bounce or an upward trend.
However, it is important to note that the RSI indicator is not a standalone trading strategy. It is best used in conjunction with other technical indicators and tools to confirm signals and identify potential trading opportunities.
Read Also: Mastering the Art of Sideways Trading Options | Useful Tips and Strategies
For example, traders may use the RSI in combination with trendlines, support and resistance levels, or other momentum indicators to validate signals and make more informed trading decisions.
Furthermore, it is important to consider the overall market context and fundamental factors when interpreting RSI readings. A high RSI reading in an uptrending market may not necessarily be a bearish signal if there are strong bullish fundamentals supporting the price. Similarly, a low RSI reading in a downtrending market may not necessarily be a bullish signal if there are strong bearish fundamentals causing the decline.
In conclusion, the RSI indicator is a valuable tool in identifying overbought and oversold conditions in the market. However, it should be used as part of a comprehensive trading strategy and in conjunction with other indicators and tools. By understanding the role of the RSI indicator and its limitations, traders can make more informed trading decisions and increase their chances of success in the markets.
RSI divergence is a tool used by traders to identify potential trend reversals. It occurs when the price of an asset is moving in one direction, but the RSI indicator is moving in the opposite direction. This can indicate a weakening trend and a possible upcoming reversal.
RSI divergence can be a useful tool for traders, but it is not always reliable. Like any other indicator, it has its limitations and should not be used as the sole basis for making trading decisions. It should be used in conjunction with other technical analysis tools and indicators to confirm signals.

There are several limitations to RSI divergence. Firstly, it is a lagging indicator, which means that it may not always provide timely signals. Secondly, it can give false signals in ranging markets where there is no clear trend. Lastly, it is important for traders to be aware of false positives and confirm signals with other indicators to avoid unnecessary losses.
Traders can use RSI divergence in a few ways. Firstly, it can be used to identify potential trend reversals and take contrarian positions. Secondly, it can be used to confirm trends and take trades in the direction of the prevailing trend. Lastly, it can be used as a tool to manage risk by placing stop-loss orders based on RSI divergence signals.
Yes, RSI divergence can fail. It is not a foolproof indicator and there will be instances where it gives false signals or fails to provide timely signals. Traders should not rely solely on RSI divergence and should use it in conjunction with other technical analysis tools and indicators to increase the accuracy of their trading decisions.

Understanding Morning Star and Evening Star Forex Patterns Forex candlestick patterns are a popular tool used by traders to forecast market movements. …
Read Article
What is Sanjeev Kapoor’s net worth? Sanjeev Kapoor, the renowned Indian chef, has gained worldwide recognition for his culinary expertise and …
Read Article
Is Nokia N8 camera good? The Nokia N8 has garnered a lot of attention for its exceptional camera capabilities. With a 12-megapixel sensor, Carl Zeiss …
Read Article
What are the necessary requirements for trading? Starting a career in trading can be an exciting and potentially profitable venture. However, it is …
Read Article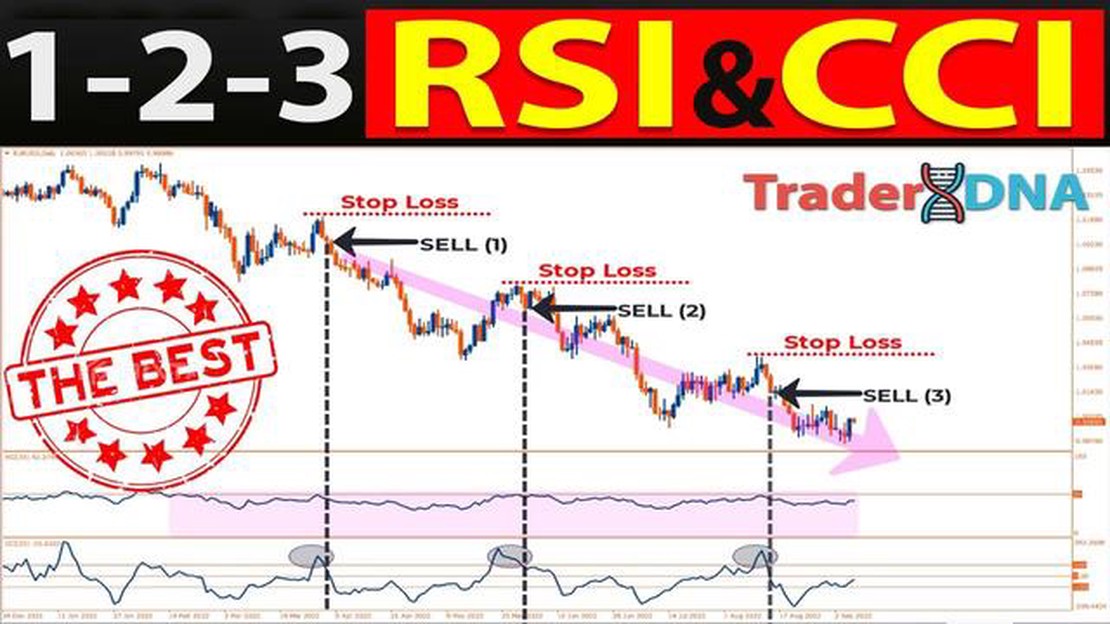
Are RSI and CCI the same thing? Investors and traders often rely on technical analysis to make decisions about buying and selling stocks. Two popular …
Read Article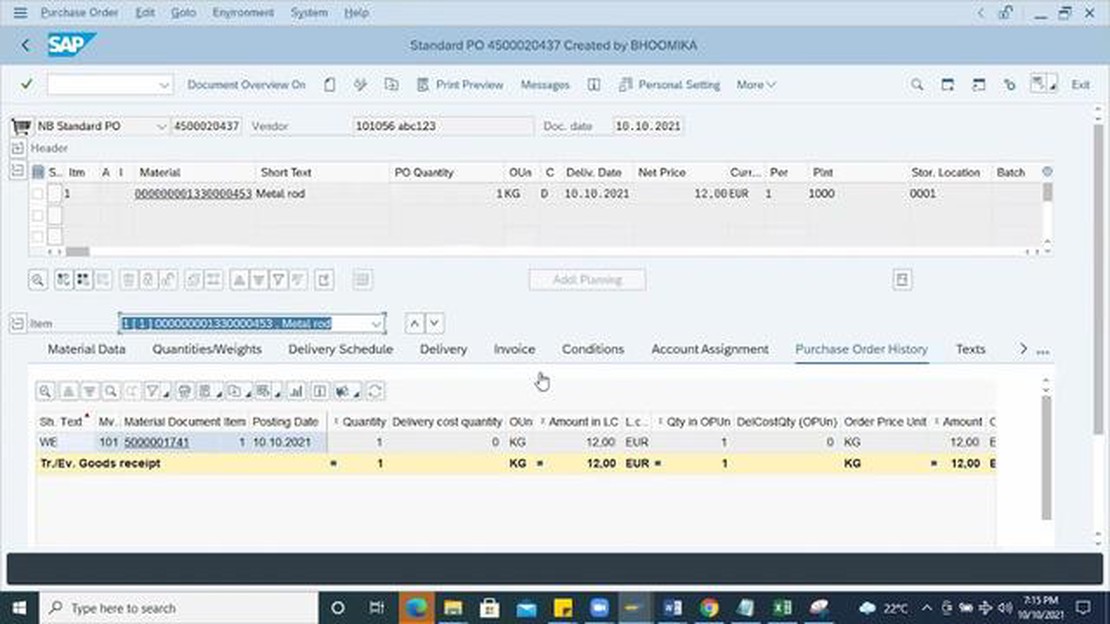
Understanding the Concept of Standard Price in SAP In SAP, the concept of standard price plays a crucial role in managing and controlling costs within …
Read Article

