


When did Eurex start? History and Timeline of Eurex Exchange
When did Eurex start? Eurex Exchange, one of the leading global derivatives exchanges, has a rich history that spans several decades. The exchange was …
Read Article
When it comes to trading strategies, one of the key tools used by traders is the moving average. This indicator is widely popular and helps investors analyze the price trends of assets over a specific period of time. By calculating the average price over a defined number of periods, traders can identify potential entry and exit points for their trades.
But how do traders determine the optimal moving average levels to use in their strategies? This article will uncover the top moving average levels that traders can consider when implementing their trading plans. By understanding the different types of moving averages and their strengths, traders can gain an edge in the market and increase their chances of success.
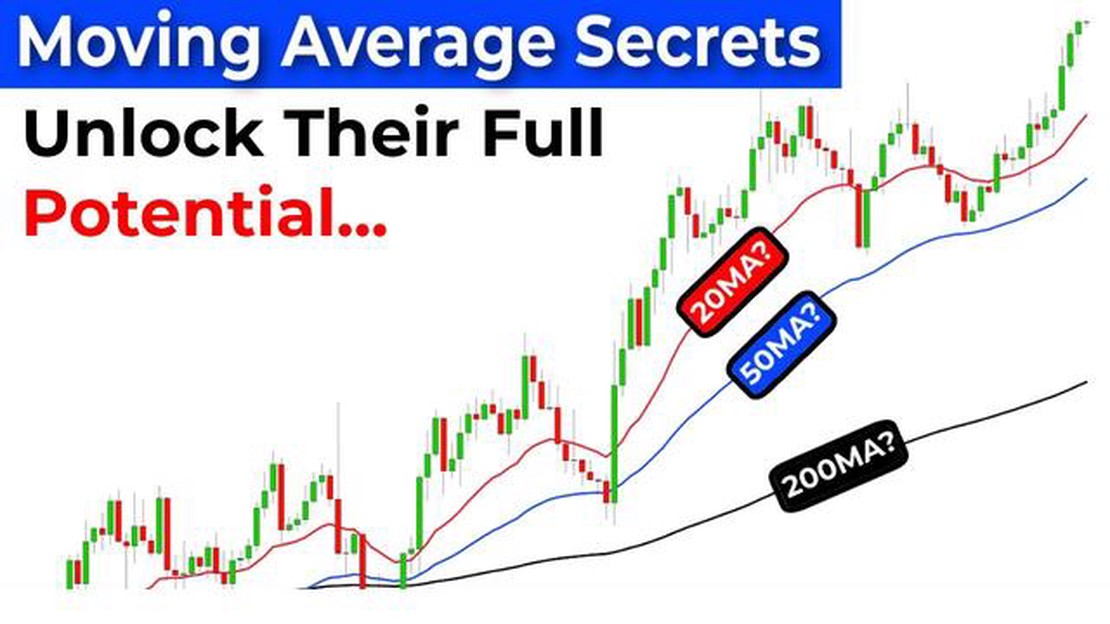
One of the most commonly used moving averages is the simple moving average (SMA). This type of moving average calculates the average price over a specific number of periods, giving equal weight to each price point. Traders often use the 50-day and 200-day SMAs as key levels of support and resistance. When the price crosses above the 50-day SMA, it is seen as a bullish signal, while a cross below the 200-day SMA is considered bearish.
Another popular moving average is the exponential moving average (EMA). This type of moving average gives more weight to recent price data, making it more responsive to changes in price trends. Traders often use the 9-day and 21-day EMAs as key levels for short-term trading strategies. When the price crosses above the 9-day EMA, it can signal a potential buy opportunity, while a cross below the 21-day EMA may indicate a sell signal.
In addition to these moving average levels, traders can also consider using other variations like the weighted moving average (WMA) or the Hull moving average (HMA). Each type of moving average has its own unique characteristics and can be tailored to fit different trading styles and timeframes. By testing and experimenting with different moving average levels, traders can find the optimal settings that work best for their individual trading strategies.
Disclaimer: This article is for informational purposes only and should not be considered as financial advice. Trading in the financial markets involves risk and may not be suitable for all investors. Always do your own research and consult with a licensed financial advisor before making any investment decisions.
When it comes to successful trading, one of the key tools that traders use is the moving average. A moving average is a popular technical indicator that helps traders identify trends and potential entry and exit points in the market. It is calculated by averaging the price of a financial instrument over a specific period of time.

There are different types of moving averages, including the simple moving average (SMA), the exponential moving average (EMA), and the weighted moving average (WMA). Each type has its own strengths and weaknesses, and traders often experiment with different types to find the best moving average levels for their trading strategies.
The best moving average levels for successful trading depend on various factors, such as the time frame of the chart, the type of financial instrument being traded, and the trader’s individual trading style and risk tolerance. However, there are some commonly used moving average levels that have been proven to be effective in many trading strategies.
| Moving Average Type | Recommended Levels | Trading Strategy |
|---|---|---|
| SMA | 50-day and 200-day | Trend following |
| EMA | 9-day and 21-day | Short-term trading |
| WMA | 5-day and 10-day | Volatility trading |
In trend following strategies, traders often use the 50-day and 200-day SMAs as key levels. The 50-day SMA is considered a short-term trend indicator, while the 200-day SMA is considered a long-term trend indicator. When the price is above both SMAs, it suggests an uptrend, and when the price is below both SMAs, it suggests a downtrend.
For short-term trading strategies, traders may use the 9-day and 21-day EMAs as key levels. These EMAs are more responsive to recent price movements and can help traders identify short-term trends and potential reversal points.
Volatility trading strategies often utilize the 5-day and 10-day WMAs as key levels. These WMAs give more weight to recent price data, allowing traders to capture short-term price changes due to volatility.
Read Also: Understanding the Impact of Shifting Data on Standard Deviation
It is important to note that these recommended moving average levels are not set in stone and may vary depending on market conditions and individual trading preferences. Traders should always conduct their own analysis and backtesting to determine the most effective moving average levels for their specific trading strategies.
In conclusion, the best moving average levels for successful trading depend on various factors and can vary from trader to trader. However, the 50-day and 200-day SMAs, 9-day and 21-day EMAs, and 5-day and 10-day WMAs are commonly used and have proven to be effective in many trading strategies. Traders should always remember to combine moving averages with other technical indicators and risk management strategies to maximize their chances of success.
Read Also: When does the New York trading session close? | Learn about the closing time
In the world of trading, moving averages play a crucial role in analyzing market trends and making informed trading decisions. A moving average is a widely used technical indicator that smooths out price data by creating a constantly updated average price over a specific time period.
One of the main advantages of using moving averages is their ability to clearly identify the direction of a trend. By plotting the average price over a certain period, traders can easily determine whether a market is trending upward, downward, or experiencing a sideways movement. This information is invaluable for traders as it helps them enter and exit trades at the most optimal times.
Moreover, moving averages can also act as support and resistance levels. When the price of an asset is trending above its moving average, the average acts as a support level, providing a potential buying opportunity. Conversely, when the price is trending below the moving average, it functions as a resistance level, signaling a possible selling opportunity.
Another important use of moving averages is in determining potential entry and exit points. Traders often look for the intersection of two moving averages as a signal to enter or exit a trade. For example, a trader may decide to enter a long position when a shorter-term moving average crosses above a longer-term moving average, indicating a bullish trend. On the other hand, a trader may choose to exit a trade when the shorter-term moving average crosses below the longer-term moving average, signaling a bearish trend.
Additionally, moving averages can help traders identify price reversals and confirm the strength of a trend. When the price crosses above or below a moving average, it may indicate a potential change in the direction of the trend. Traders can use this information to adjust their strategies or take advantage of new trading opportunities.
In summary, moving averages are powerful tools for traders in analyzing market trends, identifying support and resistance levels, determining entry and exit points, and confirming the strength of a trend. By incorporating moving averages into their trading strategies, traders can gain a better understanding of market dynamics and enhance their chances of success in the financial markets.

A moving average is a commonly used statistical indicator that calculates the average of a set of values over a specific period of time. It helps smooth out fluctuations in data and is often used in financial markets to identify trends and potential trading opportunities.
Moving average levels are significant in trading strategies because they can help identify key support and resistance levels in the market. Traders often use moving averages to determine entry and exit points, as well as to confirm the direction of a trend.
Choosing the optimal moving average level for your trading strategy depends on various factors, including the timeframe you are trading, the market you are trading in, and your specific trading goals. It is important to experiment with different moving average levels and assess their effectiveness in your strategy.
Some commonly used moving average levels in trading include the 50-day moving average, the 100-day moving average, and the 200-day moving average. These levels are often considered key support and resistance levels and are closely watched by traders.
Yes, there are many technical indicators that are often used in conjunction with moving averages. Some examples include the MACD (Moving Average Convergence Divergence), the RSI (Relative Strength Index), and the Stochastic Oscillator. These indicators can help confirm trading signals provided by moving averages.
Moving averages are statistical calculations used to analyze data over a certain period of time by smoothing out price fluctuations. They are important in trading strategies because they help traders identify trends and potential trading signals.

When did Eurex start? Eurex Exchange, one of the leading global derivatives exchanges, has a rich history that spans several decades. The exchange was …
Read Article
Upgrading Your Options Level on Questrade If you’re an active investor or trader, you may be interested in exploring options trading. Options can …
Read Article
Understanding the Dragon Pattern Chart in Trading The Dragon Pattern Chart is a powerful tool that is commonly used by traders and investors to …
Read Article
What Does DJI Stand for in the Stock Market? The DJIA, or Dow Jones Industrial Average, is a widely recognized stock market indicator that plays a …
Read Article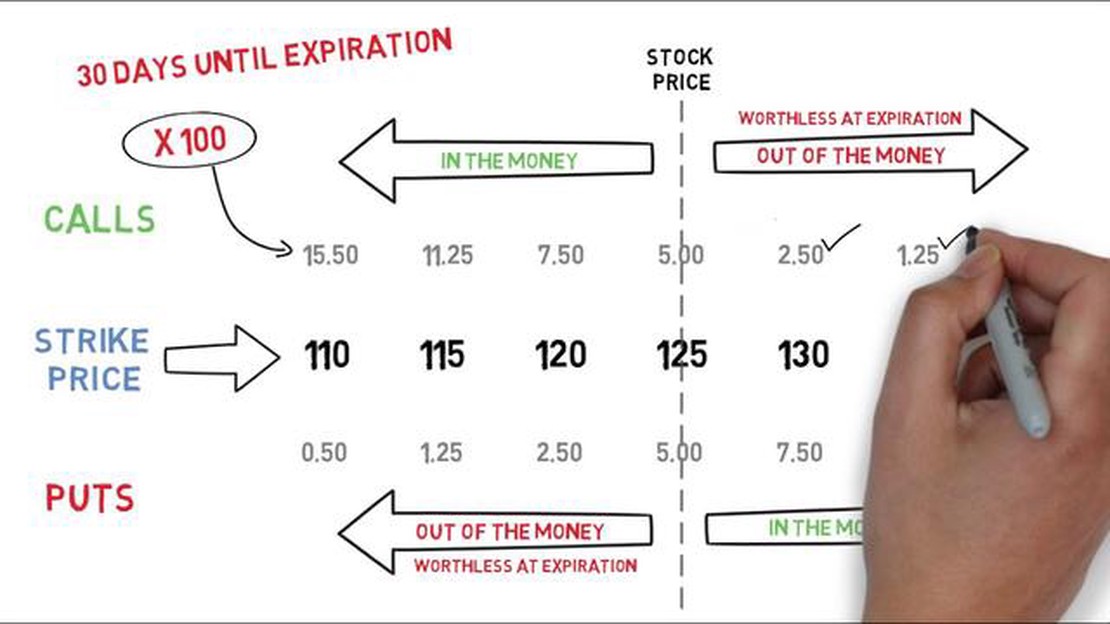
Understanding the Option Value Calculator Option value calculator is a powerful tool used in financial markets to determine the value of an option …
Read Article
Understanding the Process of Exercising Stock Options Stock options are a common form of compensation that many employers offer to their employees. …
Read Article


