

Types of Analysis Used by Day Traders: A Comprehensive Guide
Day Trader Analysis Techniques: A Comprehensive Guide Day trading, a popular form of short-term investing, requires diligent analysis and …
Read Article
When it comes to analyzing market trends and making informed investment decisions, traders and investors have developed a wide array of technical indicators. One such indicator, the 10-day Zweig Breadth Thrust Indicator, has gained popularity in recent years due to its ability to accurately predict short-term market movements.
The Zweig Breadth Thrust Indicator is named after its creator, Martin Zweig, who was a prominent market analyst and investor. It measures market breadth by comparing the number of advancing stocks to the number of declining stocks over a 10-day period. This indicator provides a clear picture of market sentiment and the level of participation from both bullish and bearish investors.
One of the key features of the 10-day Zweig Breadth Thrust Indicator is its ability to identify periods of extreme market sentiment. When the indicator rises above a certain threshold, it indicates that a significant number of stocks are experiencing upward momentum. This suggests that the market is likely to continue its upward trajectory in the short term. Conversely, when the indicator falls below a certain threshold, it signals that a large number of stocks are experiencing downward momentum, indicating a potential decline in the market.
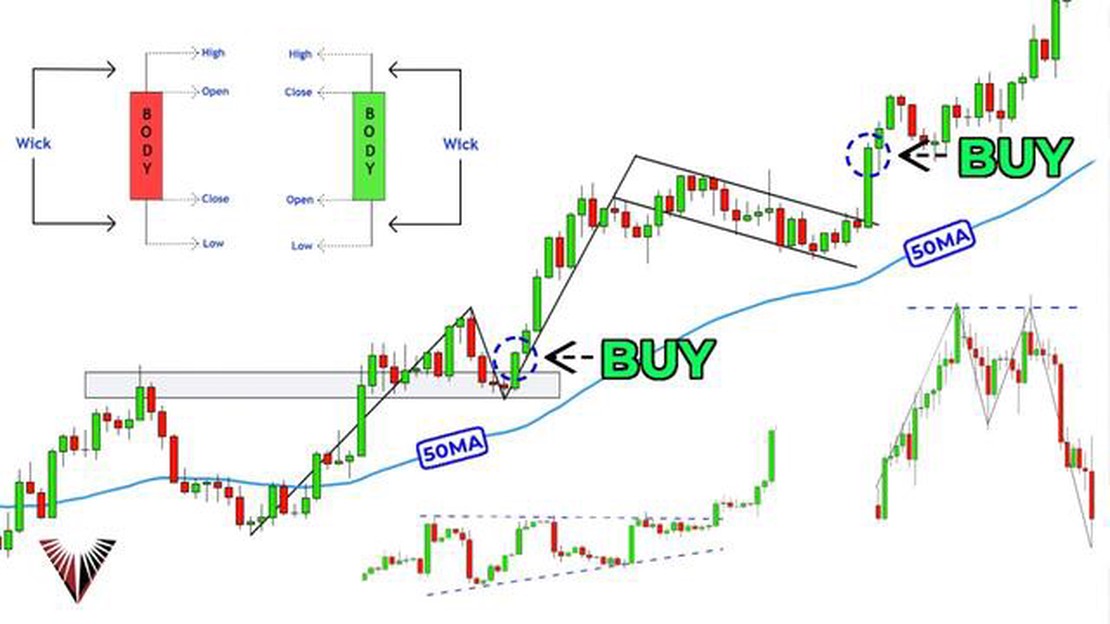
Traders and investors can use the 10-day Zweig Breadth Thrust Indicator as a confirmation tool for their existing trading strategies. By combining the signals from this indicator with other technical indicators, such as moving averages or trend lines, traders can increase the probability of making successful trades. Additionally, the indicator can also be used as a standalone tool for short-term trading strategies.
In conclusion, the 10-day Zweig Breadth Thrust Indicator is a valuable tool for traders and investors looking to capitalize on short-term market movements. Its ability to accurately gauge market sentiment and identify periods of extreme sentiment make it a powerful indicator in predicting market trends. Whether used alone or in combination with other technical indicators, the Zweig Breadth Thrust Indicator can provide valuable insights and help traders make informed investment decisions.
The Zweig Breadth Thrust Indicator is a technical analysis tool that measures the momentum of a stock market. Developed by Martin Zweig, this indicator is designed to identify periods of significant buying or selling pressure in the market.

The Zweig Breadth Thrust Indicator is calculated by taking the ratio of advancing stocks to all stocks traded on a particular exchange, and dividing it by the ratio of advancing volume to declining volume. The resulting number is then smoothed using a 10-day moving average.
When the Zweig Breadth Thrust Indicator rises above a certain threshold, typically 60%, it is considered a bullish sign. This indicates that the market is experiencing strong buying pressure, as a large number of stocks are advancing. On the other hand, when the indicator falls below the threshold, it indicates that the market is experiencing selling pressure, and a decline in stock prices may be imminent.
The Zweig Breadth Thrust Indicator is often used by traders and investors as a confirmation tool. It can help identify market trends and signal potential turning points in the market. By analyzing the breadth of market participation, this indicator provides valuable insights into the underlying strength or weakness of the market as a whole.
Read Also: Understanding the Impulse Response Function in Regression Analysis
| Advancing Stocks | The number of stocks that close higher than their previous day’s closing price. |
| Declining Stocks | The number of stocks that close lower than their previous day’s closing price. |
| Advancing Volume | The total volume of shares traded in advancing stocks. |
| Declining Volume | The total volume of shares traded in declining stocks. |
The Zweig Breadth Thrust Indicator, developed by Martin Zweig, is a technical indicator that measures the strength and direction of the stock market based on the number of advancing and declining stocks. It is a powerful tool used by traders and investors to gauge the overall health of the market.
The indicator is calculated by dividing the number of advancing issues by the sum of advancing and declining issues over a specified time period, usually 10 days. A reading above 0.6 is considered bullish, indicating a strong market trend, while a reading below 0.4 is considered bearish, indicating a weak market trend. A reading between 0.4 and 0.6 suggests a neutral or indecisive market.
When the Zweig Breadth Thrust Indicator reaches extreme levels, it can provide important signals for traders. A thrust reading above 0.6, coupled with a significant increase in trading volume, is often seen as a bullish signal, indicating a high probability of a sustained market rally. On the other hand, a thrust reading below 0.4, accompanied by a sharp decline in trading volume, is considered bearish, signaling a likely market downturn.
Read Also: Discover the Most Profitable Trading Strategies
Traders can use the Zweig Breadth Thrust Indicator to confirm or validate other technical indicators or trading strategies. For example, if another indicator or strategy suggests a bullish market, a confirmation from the breadth thrust indicator may reinforce the trader’s confidence in their decision. Conversely, if there is a disagreement between the breadth thrust indicator and other indicators or strategies, it may be a warning sign to re-evaluate the market outlook.
It is important to note that the Zweig Breadth Thrust Indicator is not a standalone tool but should be used in conjunction with other technical analysis tools and indicators for a comprehensive market analysis. As with any technical indicator, false signals are possible, so it is essential to use the indicator in combination with other tools to minimize the risk of false or misleading signals.
Overall, the Zweig Breadth Thrust Indicator provides traders and investors with valuable insights into the strength and direction of the stock market. By understanding how to interpret its readings and incorporating it into their trading strategies, market participants can make more informed decisions and potentially enhance their trading success.

The Zweig Breadth Thrust Indicator is a technical analysis tool developed by Martin Zweig. It measures the strength behind market rallies by analyzing the percentage of stocks participating in the rally.
The Zweig Breadth Thrust Indicator compares the number of advancing stocks to the number of declining stocks. When the number of advancing stocks exceeds a certain threshold, it signals a strong and sustainable market rally.
The 10-day Zweig Breadth Thrust Indicator is significant because it has historically been a reliable signal of major market bottoms. When the indicator reaches a certain level, it suggests that a significant market rally is likely to occur.
You can use the Zweig Breadth Thrust Indicator as a confirmation tool for market rallies. When the indicator reaches a certain level, it can be used as a signal to enter long positions. Additionally, you can use it to identify overbought or oversold conditions in the market.
Yes, there are limitations to the Zweig Breadth Thrust Indicator. It is primarily a short-term indicator and may not be as effective during choppy or sideways markets. Additionally, it should be used in conjunction with other technical analysis tools for more accurate signals.

Day Trader Analysis Techniques: A Comprehensive Guide Day trading, a popular form of short-term investing, requires diligent analysis and …
Read Article
Understanding the Fundamentals of Options Trading Options trading is a financial strategy that involves the buying and selling of options contracts. …
Read Article
How to Use a VHF Indicator Are you a beginner in the world of VHF indicators and want to learn how to effectively use them? Look no further, as we …
Read Article
Which forex pair pays the most? When it comes to trading in the foreign exchange market, choosing the right currency pairs can make a significant …
Read Article
Ways to Avoid ECN Fees Electronic Communication Network (ECN) fees are a common concern for traders, as they can eat into profits and impact overall …
Read Article
Understanding SNR (Signal-to-Noise Ratio) in Trading+ When it comes to trading in the financial markets, understanding the Signal-to-Noise Ratio (SNR) …
Read Article


