


How to calculate a moving average in time series analysis
How to Calculate the Moving Average in Time Series Analysis Time series analysis is a statistical technique used to analyze data points collected over …
Read Article
Divergence analysis is a popular technique used by traders to identify potential trend reversals in the financial markets. One of the most commonly used indicators for divergence analysis is the Moving Average Convergence Divergence (MACD).
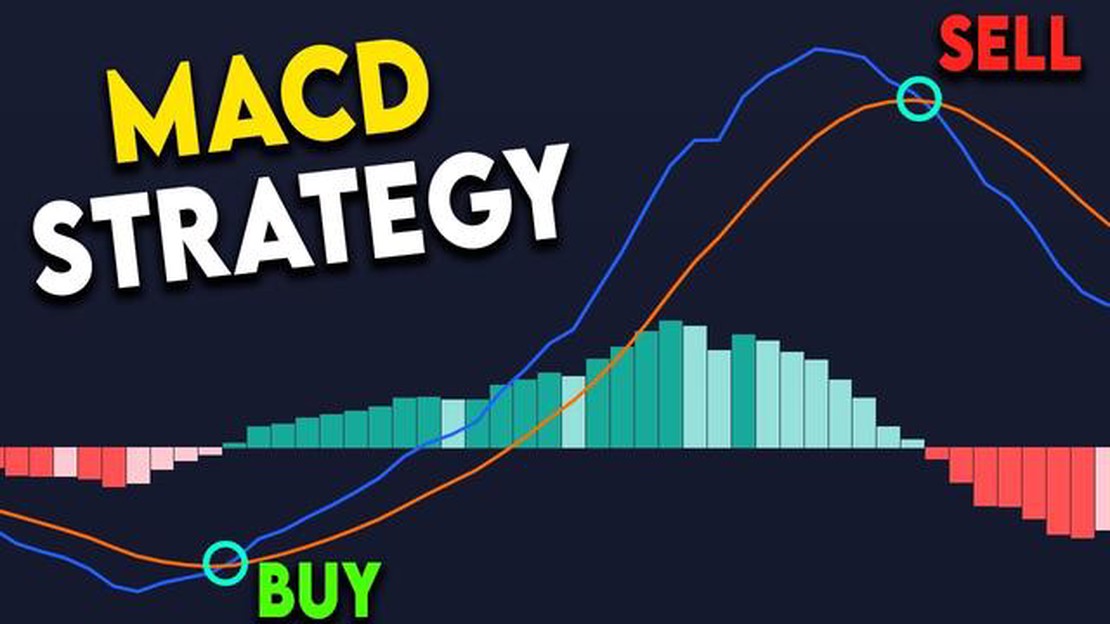
The MACD is a versatile indicator that measures the strength and momentum of a trend. It consists of two lines - the MACD line and the signal line - as well as a histogram that illustrates the difference between the two lines. When the MACD line crosses above the signal line, it is considered a bullish signal, indicating an upward trend. Conversely, when the MACD line crosses below the signal line, it is a bearish signal, indicating a downward trend.
However, while the MACD is a powerful tool for identifying trend reversals, its effectiveness can vary depending on the time frame used. Different time frames can provide different signals, and it is crucial for traders to find the optimal time frame to maximize the accuracy of their divergence analysis.
By experimenting with different time frames, traders can determine which ones produce the most reliable signals and help them make profitable trading decisions. Factors such as market volatility, trading style, and personal preferences can influence the choice of time frame. Finding the optimal time frame for MACD divergence analysis requires patience, practice, and a thorough understanding of market dynamics.
MACD divergence analysis is a popular trading strategy that traders use to identify potential trend reversals. By examining the relationship between the MACD line and the price action, traders can spot divergences that could indicate a change in market direction.
However, to effectively use MACD divergence analysis, traders need to determine the optimal time frame for their analysis. There is no one-size-fits-all answer, as the optimal time frame can vary depending on individual trading styles and preferences.
One common approach to finding the optimal time frame is by considering the overall trading strategy. Traders who prefer shorter-term trades may find that a lower time frame, such as the 1-hour or 4-hour chart, provides more accurate signals for their trading style. On the other hand, traders who take a longer-term approach may find that a higher time frame, such as the daily or weekly chart, better suits their needs.
Additionally, it’s important to consider the market you are trading. Different markets may have different characteristics, and what works for one market may not work for another. For example, the optimal time frame for MACD divergence analysis in the forex market may be different from that in the stock market or the cryptocurrency market.
Furthermore, traders should take into account their personal preferences and availability. Some traders may prefer to monitor the markets closely and be more active, while others may have limited time available for trading and need to rely on longer time frames.
In conclusion, there is no definitive answer to the optimal time frame for MACD divergence analysis. Traders should consider their trading strategy, the market they are trading, and their personal preferences when determining the best time frame for their analysis. By doing so, they can increase the accuracy of their signals and improve their overall trading performance.
MACD (Moving Average Convergence Divergence) is a popular momentum indicator used by traders to identify potential trend reversals and trade signals. While MACD is commonly used to analyze price movements, it can also be applied to identify divergences between the MACD line and price.
MACD divergence analysis involves comparing the direction of the MACD line with the direction of price movement. Divergences occur when the MACD line and price move in opposite directions, signaling a potential shift in momentum.
There are two main types of MACD divergences: bullish and bearish. A bullish divergence occurs when the MACD line forms higher lows while the price forms lower lows. This suggests that while the price is declining, momentum is starting to shift to the upside. Conversely, a bearish divergence occurs when the MACD line forms lower highs while the price forms higher highs. This indicates that while the price is rising, momentum is weakening.

Unleashing the power of MACD divergence analysis involves selecting the optimal time frame to analyze divergences. The time frame chosen should depend on the trader’s trading style and objectives. For short-term traders, shorter time frames such as 5-minute or 15-minute charts may provide more timely and actionable signals. On the other hand, longer time frames like daily or weekly charts may be more suitable for long-term traders to help identify major trend reversals.
It is important to note that MACD divergence analysis should not be used in isolation but in conjunction with other technical indicators and analysis techniques. It is also essential to consider other factors such as volume, support/resistance levels, and market conditions to validate the signals generated by MACD divergence analysis.
In conclusion, MACD divergence analysis is a powerful tool for traders to identify potential trend reversals and trade signals. By selecting the optimal time frame and combining it with other technical analysis tools, traders can enhance their trading strategies and improve their chances of success in the market.
When it comes to MACD divergence analysis, choosing the right time frame is crucial. The time frame you select can greatly affect the accuracy of your analysis and the signals you generate. In this article, we will explore different time frames and help you find the perfect one for your MACD divergence analysis.
Read Also: Withdrawal Methods: How to Get Your Money from Forex
3. These time frames provide more frequent signals but can also produce more false signals. 4. If you prefer active trading and can closely monitor the market, shorter time frames may be suitable for you. 5. Medium Time Frames:
Read Also: Discover the methods to calculate the real exchange rate accurately6. Medium time frames, like daily or weekly charts, are popular among swing traders. 7. These time frames offer a balanced approach, providing signals that are moderately frequent and reliable. 8. If you are looking for trades that last a few days to a few weeks, medium time frames may be a good fit for you. 9. Longer Time Frames: 10. Longer time frames, such as monthly or quarterly charts, are suited for long-term investors.
 11. These time frames generate fewer signals but offer more reliable and long-lasting trends.
12. If you prefer a more patient approach to trading and are interested in long-term investments, longer time frames may be the best choice.
13. Experiment and Adjust:
11. These time frames generate fewer signals but offer more reliable and long-lasting trends.
12. If you prefer a more patient approach to trading and are interested in long-term investments, longer time frames may be the best choice.
13. Experiment and Adjust:
Ultimately, the perfect time frame for MACD divergence analysis depends on your trading style, goals, and preferences. It’s important to experiment with different time frames and adjust accordingly.
Consider the types of trades you want to make, the amount of time you can dedicate to monitoring the market, and your risk tolerance. Finding the perfect time frame for MACD divergence analysis may require trial and error, but it is an essential step in improving the accuracy of your trading signals.
In conclusion, choosing the right time frame for MACD divergence analysis is a personal decision. Understanding the pros and cons of different time frames and aligning them with your trading objectives will help you find the perfect one. Remember to always analyze the market and make informed decisions based on a combination of time frame and other technical indicators.
MACD divergence analysis is a popular technical analysis tool that helps traders to identify potential reversals in the price trend by comparing the MACD (Moving Average Convergence Divergence) indicator with the price chart.
Finding the optimal time frame for MACD divergence analysis is important because different time frames can provide different signals and levels of accuracy. By identifying the optimal time frame, traders can increase the likelihood of identifying valid divergence signals and making profitable trading decisions.
Determining the optimal time frame for MACD divergence analysis involves testing different time frames and analyzing the accuracy of the divergence signals generated. Traders can start by testing shorter time frames, such as 5 or 15 minutes, and gradually increase the time frame until they find the one that consistently provides reliable divergence signals.
Using a longer time frame for MACD divergence analysis can result in delayed signals, as it takes longer for the indicator to respond to changes in the price trend. Additionally, longer time frames may produce fewer signals, which can limit trading opportunities.
Yes, traders often use other indicators, such as RSI (Relative Strength Index) or Stochastic Oscillator, in conjunction with MACD divergence analysis to confirm signals and increase the accuracy of their trading decisions.
MACD divergence analysis is a technique used in technical analysis to identify potential trend reversals. It involves comparing the movement of the MACD (Moving Average Convergence Divergence) indicator with the price of a security. When the MACD and price move in opposite directions, it is considered a divergence, suggesting a possible change in trend.
MACD divergence analysis can be useful to traders as it provides early indications of potential trend reversals. By identifying divergences between the MACD and price, traders can anticipate changes in market sentiment and take advantage of new trading opportunities. It can help traders to confirm or invalidate their trading strategies and make more informed decisions.

How to Calculate the Moving Average in Time Series Analysis Time series analysis is a statistical technique used to analyze data points collected over …
Read Article
FX options: American or European? When it comes to trading FX options, understanding the difference between American and European options is crucial. …
Read Article
What is the average bonus for Morgan Stanley? As one of the leading financial institutions, Morgan Stanley is known for its competitive compensation …
Read Article
Is forex trading trusted? Forex trading, or foreign exchange trading, is a global marketplace where currencies are bought and sold. It is the largest …
Read Article
Is TD Ameritrade Available in Canada? If you are a Canadian investor, you may be wondering if TD Ameritrade, one of the largest online brokerage …
Read Article
Signs of a Reliable Trading Site When it comes to online trading, one of the most important factors to consider is the reliability of the trading site …
Read Article


