


Does XM accept mobile money? Discover the payment options available on XM platform
Does XM Accept Mobile Money? When it comes to online trading platforms, one of the most important aspects to consider is the availability of payment …
Read Article
The DeMarker Indicator is a popular technical analysis tool used by traders to identify potential trend reversals and overbought/oversold conditions in the financial markets. Developed by Tom DeMark, this indicator is based on the concept of price exhaustion and provides valuable insights into market conditions.
But how do you determine the optimal settings for the DeMarker Indicator? In this article, we will explore different approaches and strategies to help you maximize the effectiveness of this indicator in your trading.
One approach is to experiment with different time periods for calculation. The DeMarker Indicator typically uses a 14-period lookback period, but you can adjust this setting to suit your trading style and the market you are analyzing. A shorter lookback period, such as 9 or 10, may provide more timely signals in fast-moving markets, while a longer period, such as 20 or 25, may smooth out the signals and reduce noise.
Another factor to consider is the overbought and oversold thresholds. The DeMarker Indicator typically uses a threshold of 70 to indicate overbought conditions and a threshold of 30 to indicate oversold conditions. However, you can adjust these levels based on the volatility of the market. In highly volatile markets, you may need to use higher thresholds to avoid false signals, while in less volatile markets, lower thresholds may be more appropriate.
Remember, finding the optimal settings for the DeMarker Indicator is not a one-size-fits-all approach. It requires experimentation and analysis to determine the settings that work best for your trading strategy and the market you are trading. By constantly refining and adapting these settings, you can harness the power of the DeMarker Indicator to make more informed trading decisions.
The DeMarker Indicator, also known as DeM, is a technical analysis tool that helps traders identify potential trend reversals and overbought or oversold conditions in the market. It was developed by Tom DeMark, a well-known trader and author.
The DeMarker Indicator measures the demand for an asset by comparing the current price with the previous price range. It focuses on the highs and lows of the price rather than the closing prices, which sets it apart from other momentum indicators.
The DeMarker Indicator oscillates between 0 and 1, with values above 0.7 considered overbought and values below 0.3 considered oversold. When the indicator reaches extreme levels, it suggests that the current trend may reverse in the opposite direction.

Traders often use the DeMarker Indicator in conjunction with other technical indicators or chart patterns to confirm their trading decisions. For example, if the DeMarker Indicator shows an overbought condition and a bearish divergence with the price, it may indicate a potential selling opportunity.
It is important to note that the DeMarker Indicator, like any other technical analysis tool, is not foolproof and should not be used in isolation. It is best used as part of a comprehensive trading strategy that considers other factors such as market conditions, support and resistance levels, and fundamentals.
The DeMarker Indicator is a technical analysis tool that helps identify potential trend reversals in the financial markets. It was developed by Tom DeMark and is based on the idea that market tops are often characterized by high volatility and market bottoms by low volatility.
The DeMarker Indicator calculates the demand for an asset by comparing the current price to the previous price and the previous high price. It uses a simple formula to calculate a value between 0 and 1, where values close to 0 indicate an oversold condition and values close to 1 indicate an overbought condition.
Read Also: The Advantages of Options on Futures: Explained
To calculate the DeMarker value, the formula divides the difference between the current low and the previous low by the difference between the current high and the previous high. The result is then smoothed using a moving average to produce a line that oscillates between 0 and 1.
Traders often use the DeMarker Indicator to identify potential trend reversals. When the indicator reaches extreme levels, such as above 0.7 or below 0.3, it indicates that the market may be overbought or oversold, respectively. This can be a signal that the current trend is about to reverse, and traders can use this information to enter or exit trades.
It is important to note that the DeMarker Indicator is just one tool in a trader’s toolbox and should be used in conjunction with other technical analysis tools and indicators for more reliable results. Additionally, like all indicators, the DeMarker Indicator is not infallible and can produce false signals, so it is always recommended to use it in combination with other tools and to practice proper risk management.
The DeMarker Indicator is a powerful tool used in technical analysis to identify overbought and oversold conditions in a market. However, like any other indicator, its effectiveness greatly depends on the settings used.
Read Also: Understanding the Definition of Foreign Exchange: A Comprehensive Guide
Optimal settings refer to the specific parameter values that yield the best results for a particular market or trading strategy. These settings determine the sensitivity of the indicator and can greatly impact its accuracy and usefulness.
Using suboptimal settings can lead to false signals and unreliable results. For example, if the DeMarker Indicator is set to be too sensitive, it may generate numerous false signals, resulting in a high number of unsuccessful trades. On the other hand, if the indicator is set to be less sensitive, it may fail to capture important market movements and potential trading opportunities.
Therefore, finding the optimal settings for the DeMarker Indicator is crucial for maximizing its effectiveness. Traders and analysts need to experiment with different parameter values to determine the settings that work best for their specific trading style and the characteristics of the market they are trading.
Moreover, it is important to note that optimal settings may vary over time as market conditions change. Traders should regularly reassess and fine-tune their parameter values to ensure that they remain aligned with the current market dynamics.

In conclusion, the importance of optimal settings for the DeMarker Indicator cannot be overstated. By finding and using the right parameter values, traders can enhance their decision-making process and improve their overall trading performance.
The DeMarker Indicator is a technical analysis tool that helps traders identify overbought and oversold conditions in the market.
The DeMarker Indicator is based on the comparison of the current closing price with the previous closing price. It calculates and compares values that range between 0 and 1 to determine the strength of price movements.
The optimal settings for the DeMarker Indicator depend on the specific market and timeframe you are trading. It is recommended to experiment with different settings to find what works best for your trading strategy.
Yes, some common settings for the DeMarker Indicator are a period of 14 and a level of 0.7 for identifying overbought conditions and a level of 0.3 for identifying oversold conditions. However, it is important to note that these settings may not work for every market and timeframe.
Yes, the DeMarker Indicator can be used in conjunction with other technical analysis tools to confirm trading signals or identify divergences in price movements.
The DeMarker indicator is a technical analysis tool that is used to identify potential market reversals and overbought or oversold conditions.

Does XM Accept Mobile Money? When it comes to online trading platforms, one of the most important aspects to consider is the availability of payment …
Read Article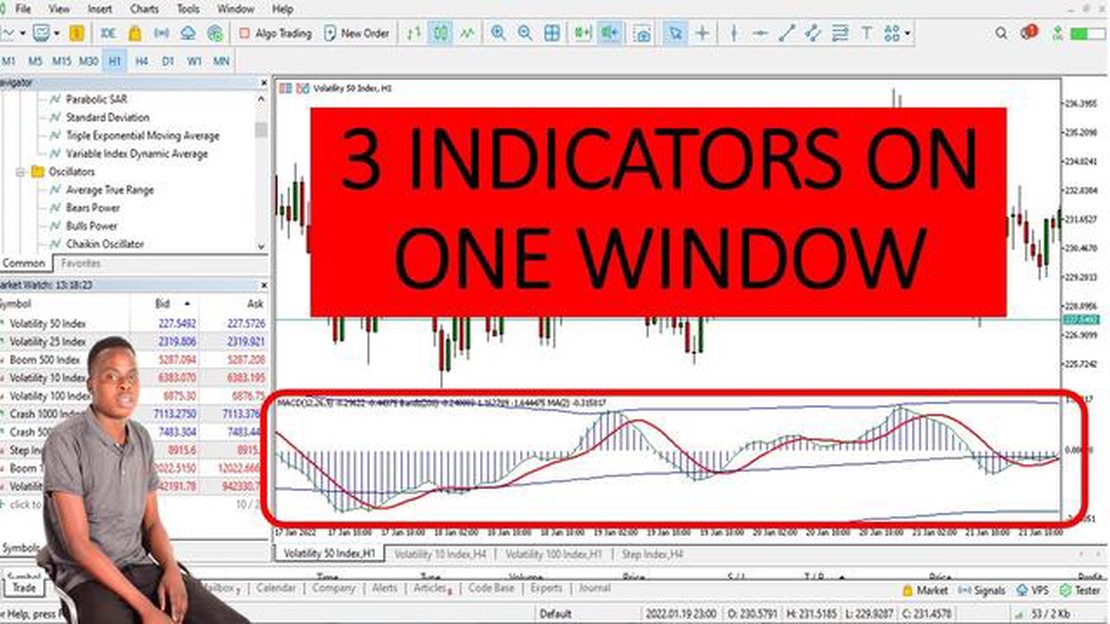
How to overlay two indicators in MT4 MetaTrader 4 (MT4) is a popular trading platform used by many forex traders around the world. One of the key …
Read Article
Learn How to Make $200 a Day in Forex Trading In the fast-paced world of forex trading, finding a consistent and profitable strategy is key to …
Read Article
Is IQ Options Legit? The Truth Behind the Popular Trading Platform IQ Options is a popular online trading platform that has gained significant …
Read Article
Understanding Reference Exchange Rates Maintaining stable exchange rates is crucial for the global economy, and reference exchange rates play a vital …
Read Article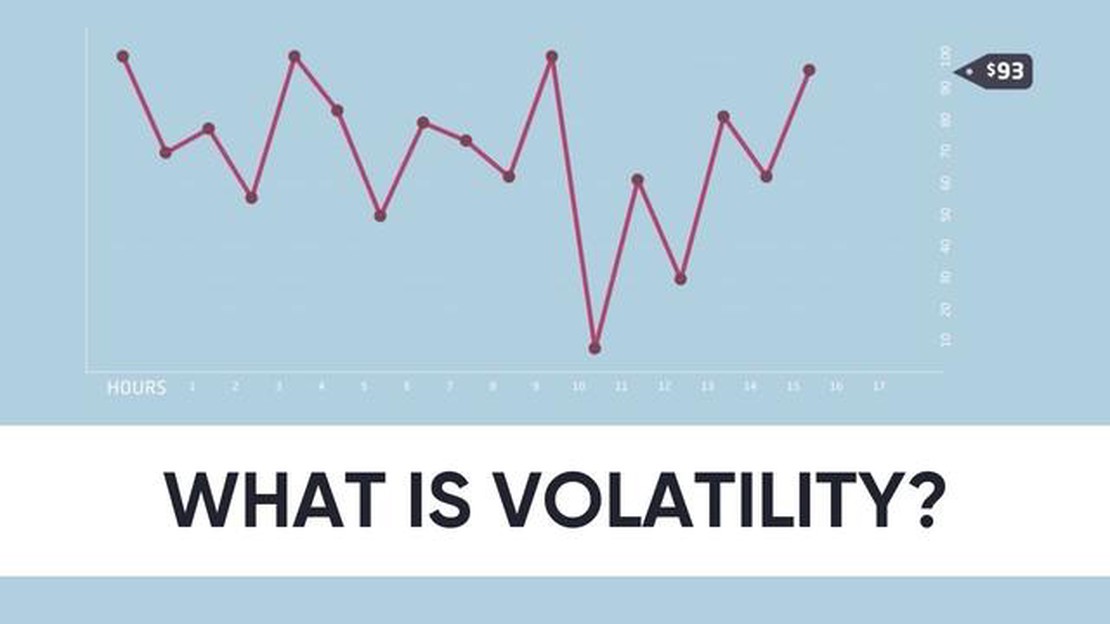
Understanding Volatility in Forex Trading Volatility is a key concept in the forex market, and understanding it is crucial for any trader looking to …
Read Article


