


Discover the Secrets of Future and Option Trading | Exclusive Guide
Understanding Future and Option Trading Welcome to our exclusive guide on future and option trading! In this article, we will delve deep into the …
Read Article
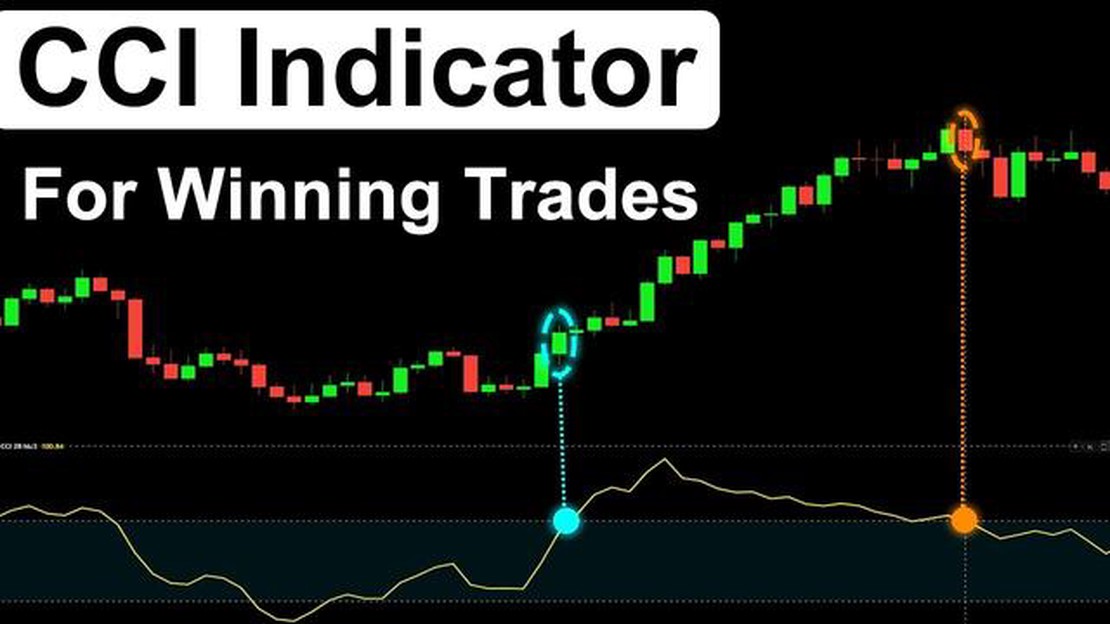
The Commodity Channel Index (CCI) indicator is a popular technical analysis tool used by traders to identify overbought and oversold conditions in the market. Developed by Donald Lambert, the CCI is utilized to help traders make informed buy or sell decisions.
In order to use the CCI effectively, it is important to determine the optimal settings for the indicator. The CCI’s default period is typically set at 20, but traders can experiment with different settings to suit their trading style and time frame.
By adjusting the period, traders can increase or decrease the sensitivity of the CCI to market fluctuations. A shorter period will provide more frequent signals, while a longer period will result in fewer but potentially more reliable signals.
Another key parameter to consider is the overbought and oversold levels. These levels are commonly set at +100 and -100, respectively. Traders may choose to adjust these levels based on their preference and the specific market conditions they are monitoring.
The Commodity Channel Index (CCI) is a popular technical indicator used to identify potential overbought or oversold conditions in a market. Developed by Donald Lambert in 1980, the CCI measures the current price level relative to an average price level over a specific period of time.
The purpose of the CCI indicator is to provide traders with an understanding of the market’s momentum and to identify potential trend reversals. It is primarily used by traders who follow a trend-following or trend-reversal strategy.
The CCI is calculated using the following formula:
CCI = (Typical Price - SMA) / (0.015 * Mean Deviation)
Where:
The CCI indicator oscillates above and below a zero line. Readings above zero indicate that the market is overbought, while readings below zero indicate that the market is oversold. Traders typically look for extreme levels of the CCI to indicate potential trend reversals.
It’s important to note that the CCI is best used in conjunction with other technical indicators and price action analysis. Traders should not rely solely on the CCI to make trading decisions, but rather use it as a confirmation tool.

Understanding the purpose and function of the CCI indicator is essential for any trader looking to utilize it in their trading strategy. By monitoring the CCI, traders can gain valuable insights into market conditions and potentially identify profitable trading opportunities.
Disclaimer: The information provided in this article is for educational purposes only and should not be considered as financial advice. Trading in financial markets involves risk, and it is important to understand the risks before engaging in any trading activity.
The Commodity Channel Index (CCI) is a popular technical indicator that was developed by Donald Lambert in 1980. Lambert was an experienced trader who wanted to create an indicator that could help identify cyclical trends in commodities.
The CCI is based on the concept that commodity prices move in cycles, with periods of uptrends and downtrends. Lambert believed that by measuring the deviation of prices from their average, he could identify when a price was overbought or oversold, indicating a potential reversal in the trend.
Read Also: Is Forex Trading Legit? Uncovering the Truth Behind Forex Trading
Lambert’s CCI formula calculates the difference between the typical price of a commodity and its simple moving average (SMA), and then divides it by the mean absolute deviation of the typical price. The result is a normalized value that oscillates between -100 and +100.
Over the years, the CCI has gained popularity among traders of various financial instruments, including stocks, futures, and forex. Traders use the CCI to identify potential buy and sell signals, as well as to determine the strength and direction of a trend.
Read Also: Understanding Stock Options for Compensation: A Comprehensive Guide
While the CCI was originally designed for commodities, it has been adapted and applied to other markets and timeframes. Traders often experiment with different settings and periods, looking for the optimal parameters that work best for their trading style and preferences.
Ultimately, the CCI is a valuable tool that helps traders analyze price movements and make informed trading decisions. By understanding the history and background of the CCI, traders can better appreciate its relevance and use it effectively in their trading strategies.
When using the CCI indicator, it is important to carefully consider the settings you choose. The settings you select will greatly impact the signals and analysis provided by the indicator. Here are some factors to take into account when deciding on the optimal settings:
By considering these factors and carefully selecting the settings for the CCI indicator, you can enhance the effectiveness of your technical analysis and improve your trading decisions.

When it comes to using the Commodity Channel Index (CCI) indicator, analyzing timeframes and market conditions is essential for successful trading. The CCI indicator can be applied to different timeframes, ranging from intraday trading to long-term investing, and understanding how it behaves in various market conditions is crucial for making informed trading decisions.
First, let’s explore the importance of analyzing different timeframes. Each timeframe provides a different perspective on price movements and helps traders identify trends and potential trading opportunities. Shorter timeframes, such as the 5-minute or 15-minute charts, are useful for day traders looking to capitalize on intraday price fluctuations. On the other hand, longer timeframes, such as the daily or weekly charts, are more suitable for swing traders or position traders who aim to capture broader market trends.
When analyzing different timeframes, it is essential to ensure that the CCI indicator settings align with the chosen timeframe. The CCI has a default setting of 14 periods, but traders can adjust it according to their specific trading goals and timeframes. Generally, shorter timeframes may require smaller CCI periods, such as 7 or 10, to capture shorter-term price movements, while longer timeframes may benefit from larger CCI periods, such as 20 or 30, to identify broader market trends.
Furthermore, understanding market conditions is equally important when using the CCI indicator. The CCI is designed to identify overbought and oversold conditions, as well as potential trend reversals. In trending markets, traders can focus on using the CCI to identify pullbacks and trade in the direction of the overall trend. Conversely, in range-bound markets, where prices are consolidating within a specific range, traders can use the CCI to identify potential reversals when the indicator reaches extreme overbought or oversold levels.
Market conditions can also impact the interpretation of CCI signals. For example, during strong trending markets, the CCI may stay in overbought or oversold territory for an extended period, indicating strong momentum and potential continuation of the trend. However, during ranging or choppy markets, the CCI may generate multiple false signals due to frequent price reversals, requiring additional confirmation from other indicators or price action analysis.
In conclusion, analyzing timeframes and market conditions is crucial when using the CCI indicator. Traders should select the appropriate timeframe and adjust the CCI settings accordingly to capture relevant price movements. Additionally, understanding market conditions can aid in interpreting CCI signals accurately and avoiding false or misleading trading signals. By combining these factors, traders can optimize the use of the CCI indicator and enhance their decision-making process.
The Commodity Channel Index (CCI) is a technical indicator used to identify overbought and oversold levels in the market. It is based on the principle that prices tend to move in cycles, and that extreme price movements are often followed by a reversal.
The CCI indicator is calculated using the following formula: CCI = (Typical Price - Moving Average of Typical Price) / (0.015 * Mean Deviation), where Typical Price is the average of high, low, and close prices, and Mean Deviation is the average of the difference between the Typical Price and the Moving Average of Typical Price over a specified period.
The optimal settings for the CCI indicator depend on various factors, including the time frame and the market being traded. However, a common default setting for the CCI indicator is a period of 14. Traders can also experiment with different time frames and periods to find the settings that work best for their trading strategy.
The CCI indicator can be used in trading to identify overbought and oversold levels in the market. Traders can look for buying opportunities when the CCI indicator moves above the oversold level and starts to turn up, indicating a potential reversal. Conversely, they can look for selling opportunities when the CCI indicator moves below the overbought level and starts to turn down. It is important to note that the CCI indicator should be used in conjunction with other technical indicators and tools for confirmation.

Understanding Future and Option Trading Welcome to our exclusive guide on future and option trading! In this article, we will delve deep into the …
Read Article
How Many Times Can I Day Trade in a Day? Day trading is a popular trading style where traders open and close positions within a single trading day. It …
Read Article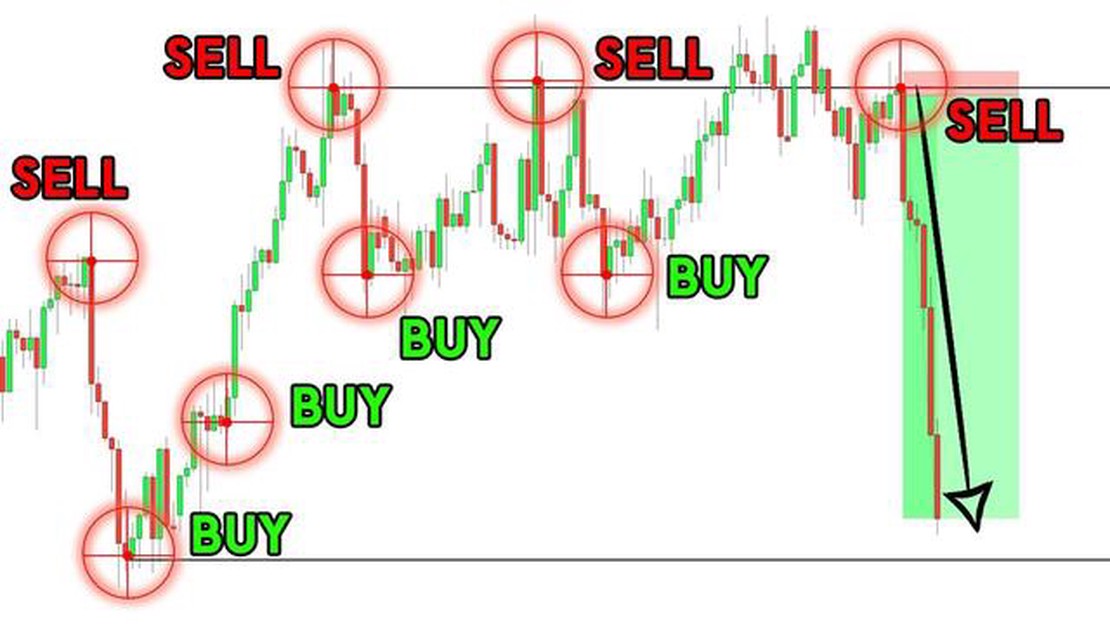
Trading Systems in Forex: A Comprehensive Guide Forex trading is a complex and dynamic market that offers enormous opportunities for both financial …
Read Article
Swissquote: Is Scalping Allowed on this Online Trading Platform? If you’re a trader looking to make quick profits in the financial markets, you may …
Read Article
How to Use Options on Fidelity App Investing in options can be a complex and risky venture, but with the right knowledge and tools, it can also be a …
Read Article
Best Platforms for Trading Commodities When it comes to trading commodities, having the right platform can make all the difference. Whether you’re a …
Read Article


