Best Simple Moving Average Settings for Day Trading
Day trading is a popular strategy among traders looking to take advantage of short-term price fluctuations in the financial markets. One commonly used tool in day trading is the Simple Moving Average (SMA). The SMA is a trend-following indicator that helps traders identify potential buy and sell signals based on the average price of an asset over a specific period of time.
However, not all SMA settings are created equal. The effectiveness of the SMA in day trading can vary depending on the time period used to calculate the average price. Finding the optimal SMA settings is crucial for maximizing profits and minimizing risk.
Table Of Contents
There are several commonly used SMA settings for day trading, including the 9-day, 20-day, and 50-day SMAs. The 9-day SMA is a short-term moving average that responds quickly to price changes, making it ideal for capturing short-term trends. The 20-day SMA is a mid-term moving average that provides a more smoothed-out view of price movements. The 50-day SMA is a long-term moving average that helps traders identify the overall trend of an asset.
It is important to note that there is no one-size-fits-all approach when it comes to SMA settings for day trading. Traders should experiment with different settings and find what works best for their trading style and the specific asset they are trading. Additionally, it is recommended to combine SMA analysis with other technical indicators and chart patterns to increase the accuracy of trade signals.
In conclusion, the SMA is a valuable tool for day traders, but finding the most effective SMA settings is essential. The 9-day, 20-day, and 50-day SMAs are commonly used settings, each serving a different purpose. Traders should experiment and find the SMA settings that align with their trading goals and strategies for successful day trading.
Popular Moving Average Settings for Day Trading
When it comes to day trading, finding the right moving average setting can be crucial for identifying trends and making profitable trades. While there is no one-size-fits-all approach, there are several popular moving average settings that are commonly used by day traders.
Here are some of the most effective moving average settings for day trading:
Setting
Description
Simple Moving Average (SMA) of 50 periods
This setting is widely used by day traders as it helps to smooth out price volatility and provides a longer-term view of the market trends.
Exponential Moving Average (EMA) of 20 periods
The EMA is another popular choice among day traders. It gives more weight to recent price data and can help to identify short-term trend reversals.
Simple Moving Average (SMA) of 200 periods
This longer-term moving average setting is commonly used to identify major long-term trends. It provides a broader view of the market and helps to filter out short-term noise.
Exponential Moving Average (EMA) of 9 periods
This fast-moving average setting is often used by day traders to identify short-term momentum shifts. It reacts quickly to recent price changes and can help to spot potential buying or selling opportunities.
It’s important to note that these moving average settings are not set in stone and can be adjusted based on individual trading strategies and preferences. Experimenting with different settings and finding what works best for your trading style is key.
Remember, moving averages are just one tool in the day trader’s toolbox. It’s important to use them in conjunction with other technical indicators and analysis methods to make informed trading decisions.
Benefits of Using Moving Averages in Day Trading
Day trading can be a fast-paced and unpredictable venture, requiring traders to make split-second decisions based on market trends and analysis. In this fast-paced environment, moving averages can be a valuable tool for day traders. Here are some of the benefits of using moving averages in day trading:
Identification of Trends: Moving averages help traders identify trends in the market. By calculating the average price over a specific period, moving averages smooth out price fluctuations and provide a clearer picture of the overall trend. This can help day traders make more informed decisions about when to enter or exit a trade.
Support and Resistance Levels: Moving averages can act as support and resistance levels in the market. When the price approaches a moving average, it may bounce off or break through, indicating potential support or resistance levels. This information can be used by day traders to set profit targets or stop losses.
Confirmation of Price Movements: Moving averages can confirm price movements. If the price crosses above a moving average, it may indicate a bullish trend, while a cross below a moving average may suggest a bearish trend. Day traders can use this confirmation to validate their trading decisions and increase their confidence in the trade.
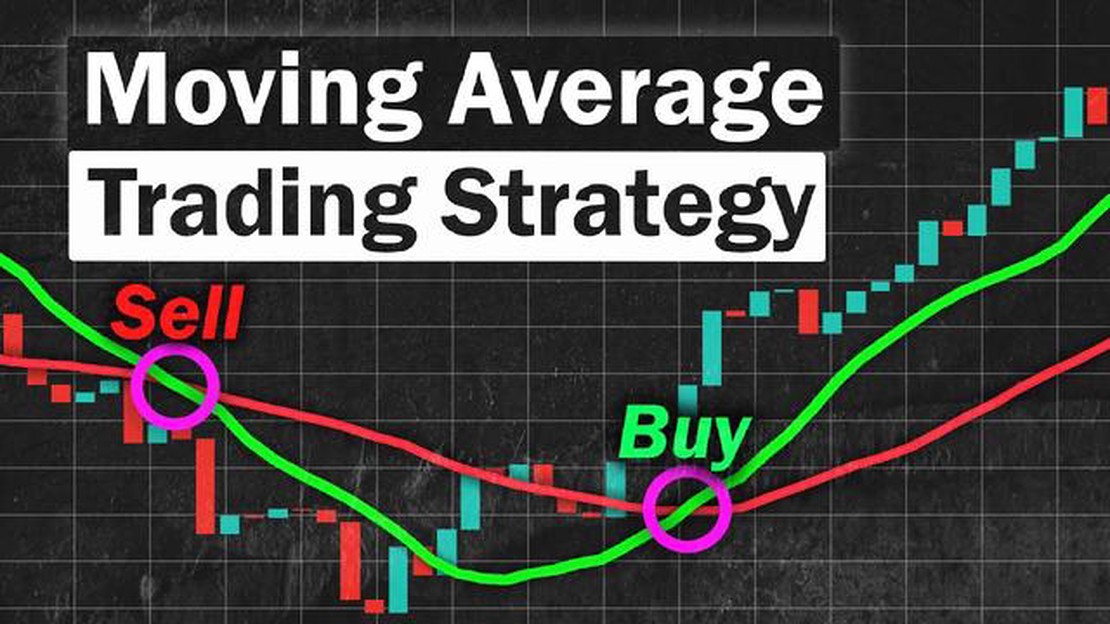
Entry and Exit Signals: Moving averages can generate entry and exit signals for day traders. For example, a crossover between a shorter-term moving average and a longer-term moving average can signal a potential entry or exit point. This can help day traders time their trades more effectively and potentially maximize their profits.
Reduction of Noise: Moving averages can help reduce market noise and filter out false signals. By smoothing out price data, moving averages can provide a clearer view of the overall market trend and eliminate short-term fluctuations that may lead to misleading trading signals.
Overall, moving averages are a valuable tool for day traders, providing them with insights into market trends, support and resistance levels, confirmation of price movements, entry and exit signals, and noise reduction. Incorporating moving averages into a day trading strategy can help traders make more informed decisions and increase their chances of success in the fast-paced world of day trading.
FAQ:
What is a simple moving average?
A simple moving average is a technical analysis tool that calculates the average price of a security over a specified number of periods and is used to identify trends and potential buying or selling signals.
How are simple moving averages calculated?
Simple moving averages are calculated by adding up the closing prices over a specified number of periods and then dividing the sum by the number of periods. For example, to calculate a 10-day simple moving average, you would add up the closing prices of the last 10 days and divide by 10.
Why is the choice of moving average settings important for day trading?
The choice of moving average settings is important for day trading because it can help traders identify short-term trends and make informed trading decisions. Different moving average settings can provide different signals, so it is important to find the settings that work best for the specific trading strategy.
What are some commonly used moving average settings for day trading?
Some commonly used moving average settings for day trading include the 50-day moving average, the 100-day moving average, and the 200-day moving average. Traders may also experiment with shorter-term moving average settings, such as the 10-day or 20-day moving average, depending on their trading style and time frame.
How do I determine the most effective moving average settings for day trading?
Determining the most effective moving average settings for day trading requires experimenting with different settings and analyzing the results. Traders can test various combinations of moving average lengths and observe how they perform in different market conditions. The most effective settings will vary for each individual trader and their unique trading strategy.
What is a simple moving average and how does it work in day trading?
A simple moving average (SMA) is a popular technical analysis tool used by day traders to identify trends and potential entry or exit points. It is calculated by adding up a set number of closing prices and dividing the sum by that number. The resulting average is then plotted on a chart to create a line. Traders use the SMA to identify trend reversals and to confirm the strength of a trend.
What are the most effective simple moving average settings for day trading?
The most effective simple moving average settings for day trading can vary depending on the trading style and the market being traded. Generally, shorter-term moving averages, such as the 5-period or 10-period SMA, are more sensitive to price movements and can help traders identify short-term trends. Longer-term moving averages, such as the 50-period or 200-period SMA, are more useful for identifying longer-term trends. It’s recommended to experiment and find the settings that work best for your specific trading strategy and the market you are trading.
Understanding Trade Coding: A Comprehensive Guide In today’s digital age, the global market is more interconnected than ever before. This connectivity …
How much can you earn trading Forex? Forex, or foreign exchange, is the largest financial market in the world. It is a decentralized marketplace where …
Techniques in the Eagle The eagle is a majestic bird known for its impressive hunting skills and grandeur. This bird of prey has captivated the human …