

Understanding the Weighted Moving Average in Ninjatrader: a Comprehensive Guide
Learn about Weighted Moving Average in NinjaTrader The Weighted Moving Average (WMA) is a popular technical analysis tool used by traders to identify …
Read Article
TradingView is a powerful platform for traders to analyze and visualize financial markets. One of the most popular indicators used on TradingView is the moving average, which helps identify trends and potential entry or exit points in the market. While TradingView offers default moving average settings, customizing them can greatly improve their effectiveness.
Step 1: Selecting the Moving Average Type
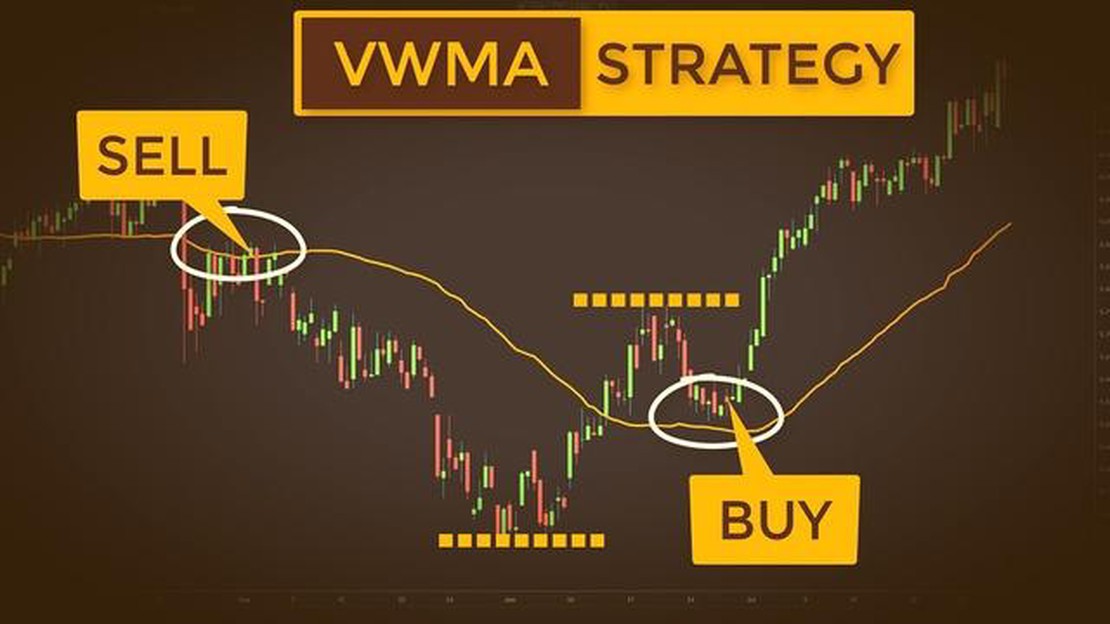
Before customizing your moving averages, it’s important to understand the different types available. TradingView offers several moving average options, such as simple moving average (SMA), exponential moving average (EMA), weighted moving average (WMA), and more. Each type has its own strengths and weaknesses, so choose the one that best suits your trading strategy.
Pro Tip: SMA is great for smoothing out price fluctuations, while EMA places more emphasis on recent price data.
Step 2: Adjusting the Period
The period refers to the number of bars or time periods used to calculate the moving average. The default period is usually set to 14, but it can be customized based on your trading style and timeframe. Longer periods provide smoother and slower-moving averages, while shorter periods react more quickly to price changes.
Pro Tip: Use shorter periods for day trading and longer periods for long-term investing.
Step 3: Adding Additional Moving Averages
To enhance your analysis, you can add multiple moving averages to your chart. This allows you to compare different timeframes and types of moving averages, providing a more comprehensive view of the market. Experiment with different combinations to find the one that works best for you.

Pro Tip: Adding a shorter-term moving average above a longer-term moving average can help identify trend reversals.
Step 4: Customizing Moving Average Colors and Styles
Read Also: How Does XM Compare When It Comes to Fixed Spreads?
TradingView allows you to customize the appearance of your moving averages to suit your preferences. You can change the color, line style, and line thickness to make them more visually appealing and easier to interpret. This customization can help you quickly identify moving average crossovers and other trading signals.
Pro Tip: Make sure to choose colors that provide a clear contrast with the background and other chart elements.
By customizing moving averages in TradingView, you can create a trading setup that aligns with your unique strategy and preferences. Experiment with different settings and combinations to find what works best for you. Remember, trading indicators are tools to assist your analysis, so it’s important to understand their strengths and limitations.
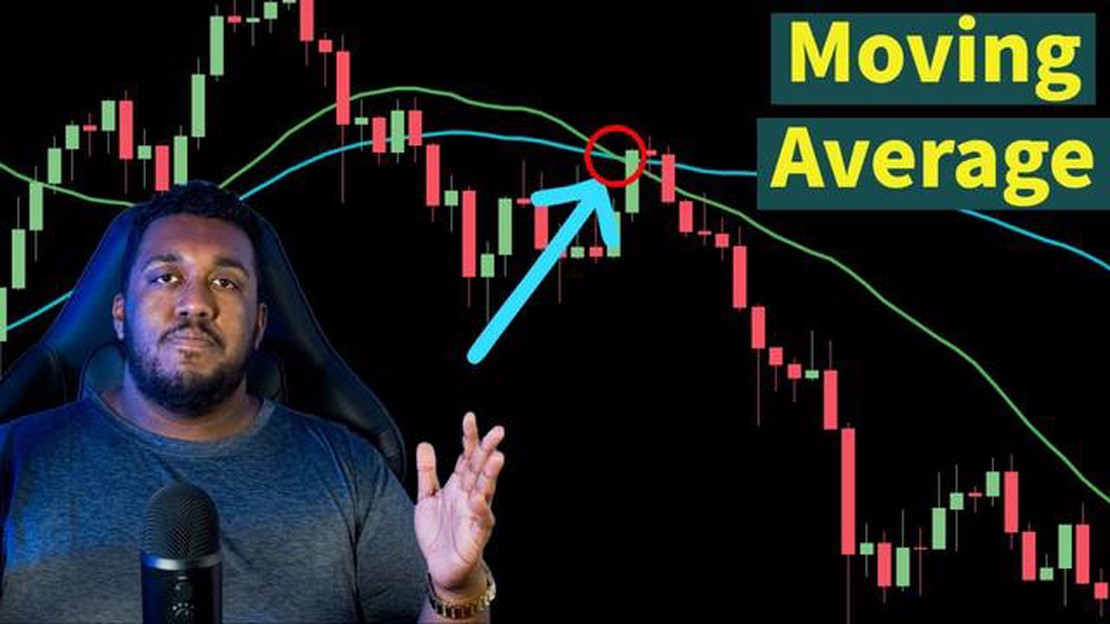
A moving average is a commonly used technical indicator in trading, which helps traders analyze and identify trends in price movements over a specific period of time. It is calculated by taking the average price of a security (such as a stock or currency pair) over a set number of time periods and then plotting those averages on a chart.
By using moving averages, traders can smooth out the volatility of price data and obtain a clearer picture of whether a stock or market is trending upwards or downwards. It is especially useful for identifying support and resistance levels, as well as potential entry or exit points for trading positions.
There are different types of moving averages, including simple moving averages (SMA) and exponential moving averages (EMA). The SMA gives equal weight to all periods in the calculation, while the EMA puts more weight on recent price data.
Read Also: Reasons behind the low performance of MDT stock
Moving averages are often used in combination with other technical indicators and chart patterns to make informed trading decisions. Traders can customize the parameters of moving averages, such as the number of time periods used, to adapt to their specific trading strategies and preferences.
Overall, moving averages provide traders with a visual representation of price trends and help them identify potential trading opportunities in the market.

Moving averages are a popular technical analysis tool used by traders to analyze trends in the financial markets. They provide a smoothed line on a price chart that helps identify the direction of the trend. TradingView offers various customization options for moving averages, allowing traders to tailor them to their specific needs.
Here are some ways you can customize moving averages in TradingView:
Customizing moving averages in TradingView allows traders to adapt these technical indicators to their own trading strategy and preferences. By adjusting the period, type, color, line style, and visibility, traders can create moving averages that provide a clear and personalized view of market trends.
Moving averages are technical indicators used in trading to smooth out price data and identify trends over a specific time period.
To customize moving averages in TradingView, you can adjust the period, type, and source. You can also add multiple moving averages to a chart and choose different colors and line styles.
Adjusting the period of a moving average means changing the time period over which the average is calculated. A shorter period will make the moving average more sensitive to recent price changes, while a longer period will make it less sensitive.
Yes, TradingView offers different types of moving averages, including simple moving averages (SMA), exponential moving averages (EMA), weighted moving averages (WMA), and more. Each type of moving average calculates the average differently, giving different weight to recent price data.
The source of a moving average refers to the price data used to calculate the average. It can be based on the close price, open price, high price, low price, or even an indicator value. Choosing the right source can have an impact on the effectiveness of the moving average in predicting trends.

Learn about Weighted Moving Average in NinjaTrader The Weighted Moving Average (WMA) is a popular technical analysis tool used by traders to identify …
Read Article
Are stock options considered when filling out FAFSA? When it comes to reporting your financial information on the Free Application for Federal Student …
Read Article
Understanding ES in Futures Trading When it comes to futures trading, one of the most popular markets is the E-mini S&P 500 (ES) futures contract. It …
Read Article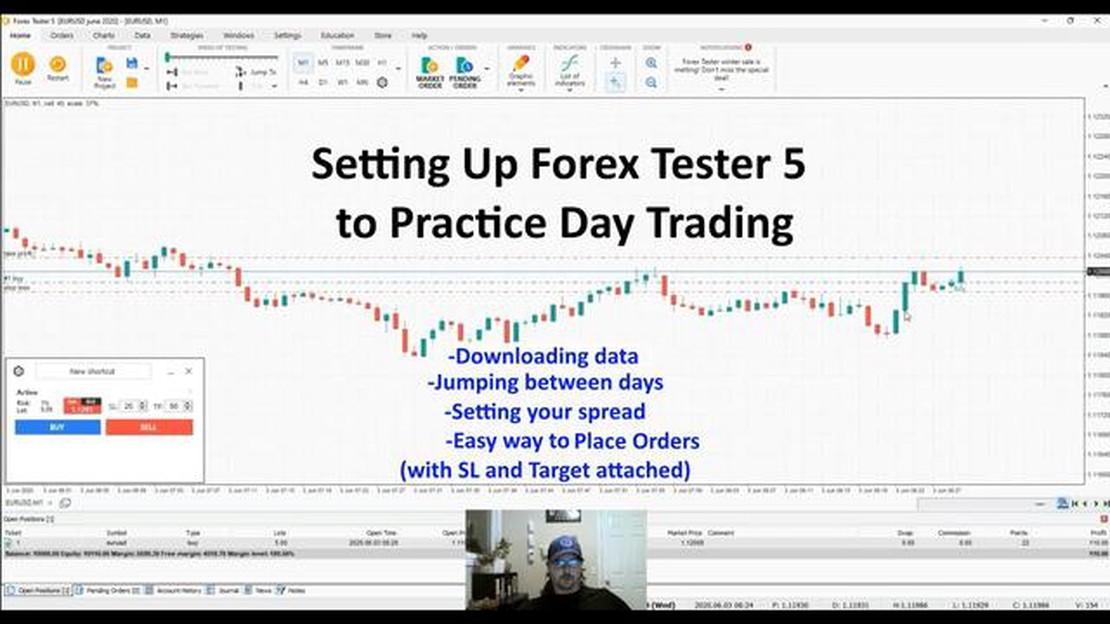
Tips and Tricks: How to Use Forex Tester If you are a trader looking to improve your forex trading skills, one tool that can help you achieve better …
Read Article
Does candle really work in stock market? The stock market is a complex and dynamic environment where investors and traders try to outperform the …
Read Article
Comparing Options Trading Methods: Choosing the Best Strategy for Success When it comes to investing in the stock market, there are various strategies …
Read Article


