
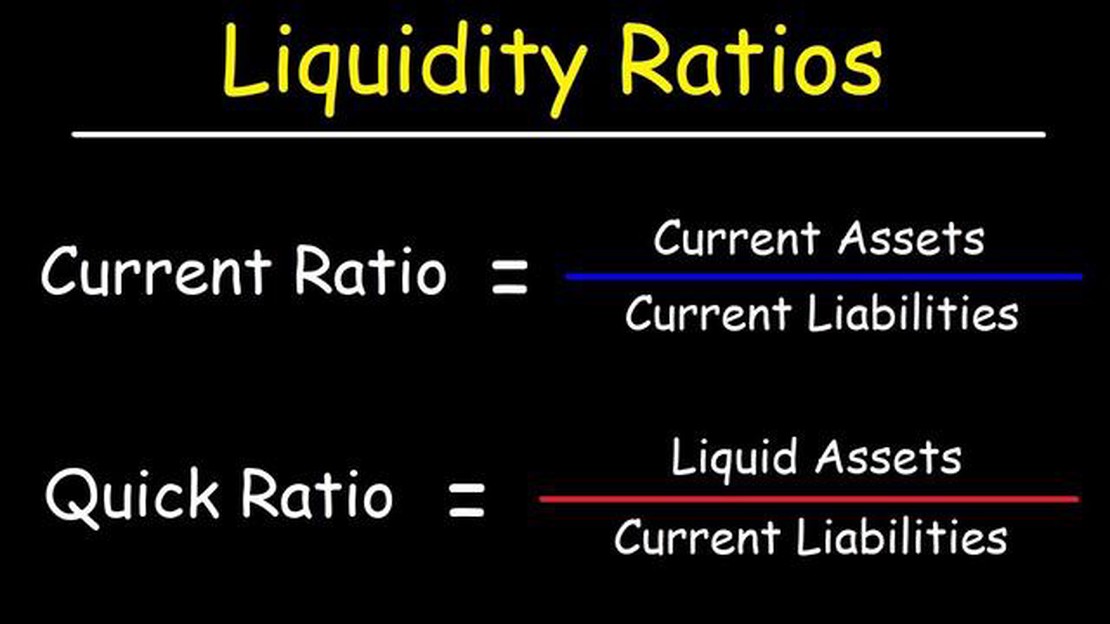

Understanding the Current Ratio Indicator in Forex Trading | A Comprehensive Guide
What is the current ratio indicator in forex? Forex trading requires a deep understanding of various indicators that can help traders make informed …
Read Article
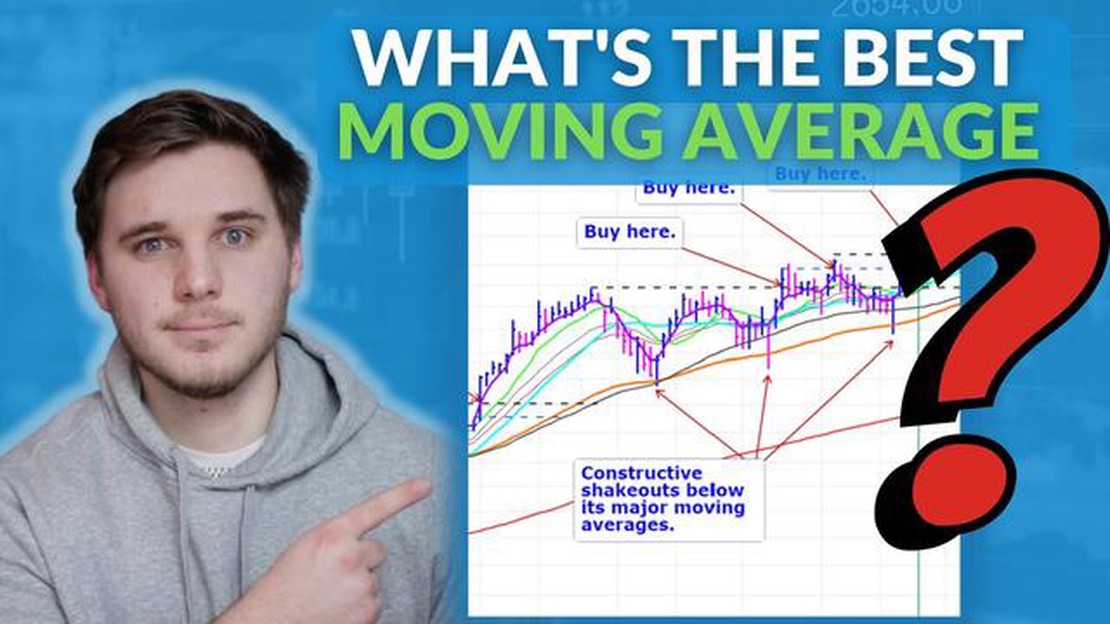
When it comes to technical analysis in stock trading, moving averages play a crucial role in determining trends and making informed decisions. However, with various types of moving averages available, it can be overwhelming to choose the most effective one for your analysis needs. In this article, we will explore the different types of moving averages and provide insights on how to select the best one for your trading strategy.
Simple Moving Average (SMA)
The Simple Moving Average (SMA) is the most basic type of moving average, calculated by taking the sum of a set of closing prices over a certain period and dividing it by the number of periods. This moving average provides a straightforward representation of the overall price trend and is useful for identifying long-term trends.
Exponential Moving Average (EMA)
The Exponential Moving Average (EMA) is more responsive to recent price changes compared to the SMA. It assigns a higher weightage to the most recent prices, making it better suited for short-term analysis. Traders who prefer to capture immediate price movements often favor the EMA over the SMA.
Weighted Moving Average (WMA)
The Weighted Moving Average (WMA) is similar to the EMA but assigns different weights to each closing price based on their order. This moving average places more emphasis on recent prices but considers previous prices as well. The WMA is useful when a trader wants to focus on recent trends while still taking into account historical data.
Choosing the Best Moving Average for Technical Analysis

When selecting the best moving average for your technical analysis, it is important to consider your trading strategy, the time frame you are analyzing, and your risk tolerance. For long-term investors, the SMA may be more suitable as it provides a broader perspective on price trends. On the other hand, short-term traders may prefer the EMA or WMA for their ability to capture immediate price movements.
Ultimately, the choice of moving average depends on the individual trader’s preference and the specific market conditions they are analyzing. It is recommended to experiment with different moving averages and combine them with other technical indicators to make well-informed trading decisions.
When it comes to technical analysis, moving averages are a popular tool used by traders and investors to identify trends and potential trading opportunities in financial markets. Moving averages are calculated by taking the average price of a security over a designated period of time. They are called “moving” averages because they continuously update as new data becomes available, thus creating a smooth line on a price chart.
There are several types of moving averages that traders use, such as the simple moving average (SMA), the exponential moving average (EMA), and the weighted moving average (WMA). The choice of moving average depends on the trader’s trading style, time frame, and the level of importance given to recent data.
The simple moving average (SMA) is the most basic type of moving average, calculated by adding up the closing prices of a security for a specified number of periods and dividing it by the number of periods. This average gives an equal weight to each data point in the calculation and is often used to identify long-term trends.
Read Also: Understanding Forex Liquidity Providers: How they Impact Trading and Market Stability
The exponential moving average (EMA) is a more complex type of moving average that gives greater weight to more recent data points. This makes the EMA more responsive to changes in price and is commonly used to identify short-term trends.
The weighted moving average (WMA) is similar to the exponential moving average but assigns different weights to each data point. The weights are typically determined by the trader based on their trading strategy and the level of importance given to recent data.
Moving averages can be used in a variety of ways in technical analysis. They can help identify support and resistance levels, generate buy or sell signals, and confirm trend reversals. Traders often use multiple moving averages of different time periods in conjunction with other technical indicators to increase the accuracy of their analysis.
It is important to note that moving averages are lagging indicators, meaning they are based on past data. Therefore, they may not always accurately predict future price movements. Traders should use moving averages in conjunction with other technical analysis tools and consider other factors such as market conditions, news events, and risk management strategies.
Read Also: Is Trading Binary Options Easy? Discover the Truth Here
In conclusion, understanding moving averages is essential for effective technical analysis. By incorporating moving averages into their analysis, traders can gain valuable insights into market trends and potential trading opportunities. It is important to choose the best moving averages that align with one’s trading strategy and goals, and to constantly adapt and refine their use based on market conditions.
Moving averages are a popular technical analysis tool used by traders and investors to determine the trend and potential trading opportunities in a financial instrument or market. A moving average is simply an average of the price of an asset over a specific period of time, which is constantly updated as new data becomes available.
The concept of moving averages is based on the idea that by smoothing out short-term price fluctuations, the underlying trend of an asset can be more easily identified. By calculating the average price over a certain period, moving averages provide a clearer picture of the overall direction of the market.
There are different types of moving averages, including simple moving averages (SMA) and exponential moving averages (EMA). Simple moving averages give equal weight to each data point in the calculation, while exponential moving averages place more importance on recent data points.
Moving averages are often used in combination with other indicators and chart patterns to generate trading signals. For example, when the price crosses above a moving average from below, it may be a signal to go long or buy, indicating that the trend is shifting to the upside. Conversely, when the price crosses below a moving average from above, it may be a signal to go short or sell, indicating a potential downtrend.

Overall, moving averages are a versatile tool that can be used to identify trends, support and resistance levels, and potential entry and exit points in the market. Traders and investors can choose the best moving averages based on their trading style, time frame, and the specific instrument or market they are analyzing.
Moving averages are used in technical analysis to smooth out price data and identify trends over a certain period of time.
Moving averages assist in technical analysis by providing a visual representation of the average price over a specific period, helping traders identify trends and potential buy or sell signals.
The different types of moving averages include simple moving averages (SMA), exponential moving averages (EMA), and weighted moving averages (WMA).
For short-term analysis, it is generally recommended to use a simple moving average (SMA) or an exponential moving average (EMA) with a shorter time period, such as 20 or 50 days.
For long-term analysis, it is often advised to use a longer period moving average, such as a 100 or 200-day simple moving average (SMA), to filter out short-term fluctuations and focus on long-term trends.
Moving averages are statistical calculations used to analyze the price data of an asset over a specific period of time. It helps to smooth out price fluctuations and identify trends.

What is the current ratio indicator in forex? Forex trading requires a deep understanding of various indicators that can help traders make informed …
Read Article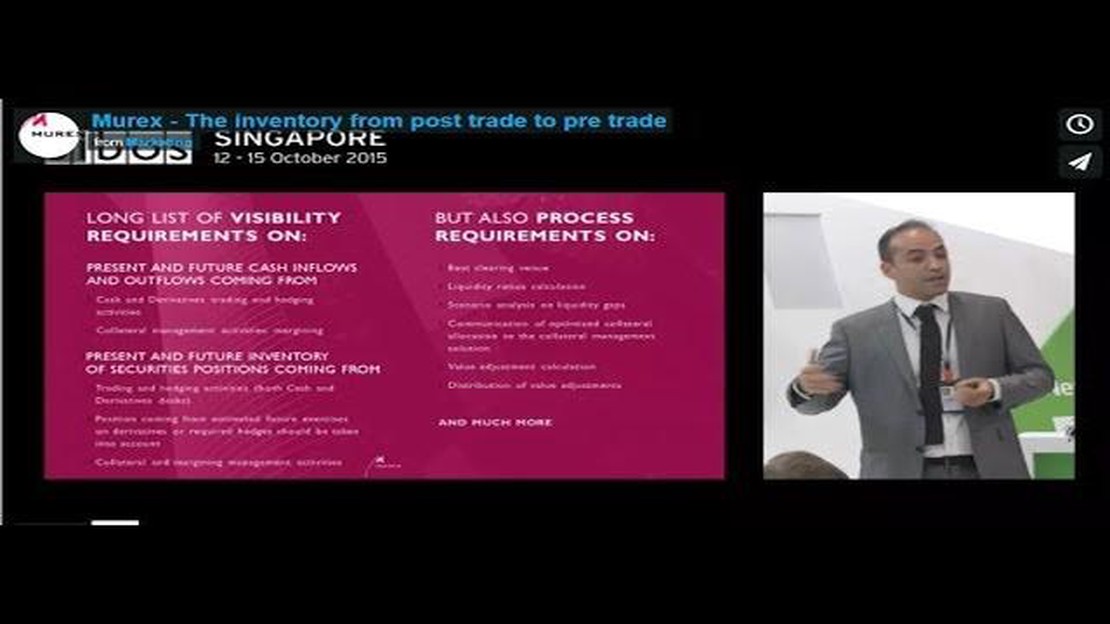
How to Obtain Murex Certification If you are looking to advance your career in finance and gain a competitive edge in the job market, obtaining a …
Read Article
Spot Rate DKK to Dollars: Explained and Updated The spot rate is an important concept in forex trading, representing the current exchange rate between …
Read Article
Forex Receiving Charges by FNB When it comes to receiving foreign currency with FNB, there are a few charges that you should be aware of. Whether …
Read Article
Informing St George Bank about your overseas travel plans Informing St George about your overseas travel plans is an important step to ensure the …
Read Article
OctaFX Minimum Deposit: Discover the Lowest Amount Required to Start Trading OctaFX is a popular online forex and CFD broker, known for its …
Read Article


