Technical analysis is a popular approach that investors use to evaluate the performance of stocks, but can it be applied to analyze the performance of exchange-traded funds (ETFs)? ETFs have gained significant popularity in recent years, offering investors a convenient way to diversify their portfolio and gain exposure to various asset classes. Like stocks, ETFs can also be analyzed using technical indicators and chart patterns to make informed investment decisions.
Table Of Contents
Technical analysis focuses on studying historical price and volume data to identify patterns and trends that can help predict future performance. Traders use a variety of tools, such as moving averages, oscillators, and support and resistance levels, to analyze the price movements of ETFs. By analyzing these patterns, traders hope to identify potential entry and exit points to maximize their profits.
However, it’s important to note that technical analysis may not be as effective when applied to ETFs as it is with individual stocks. ETFs are designed to track the performance of a specific market index or sector, and their prices are influenced by the underlying assets they hold. This means that fundamental factors, such as changes in economic conditions or company earnings, may have a greater impact on the performance of ETFs compared to technical indicators.
While technical analysis can provide insights into the short-term price movements of ETFs, it may not be sufficient for long-term investment decisions. In addition to analyzing the technical aspects, investors should also consider the fundamentals of the underlying assets and the overall market conditions. A comprehensive analysis that combines both technical and fundamental analysis is often recommended for evaluating the performance of ETFs.
In conclusion, while technical analysis can be used to analyze the performance of ETFs, it should be complemented with a thorough understanding of the underlying assets and the market conditions. By combining both technical and fundamental analysis, investors can make more informed investment decisions and potentially improve their overall portfolio performance.
Understanding ETF Performance and Technical Analysis
Exchange-Traded Funds (ETFs) have become increasingly popular among investors as a way to gain exposure to specific sectors, assets, or strategies. Understanding and analyzing the performance of ETFs is crucial for investors to make informed decisions.
Technical analysis is a commonly used approach to analyze the performance of ETFs. It involves studying historical price and volume data to identify patterns and trends. By using technical analysis, investors can gain insights into the potential future direction of an ETF’s price.
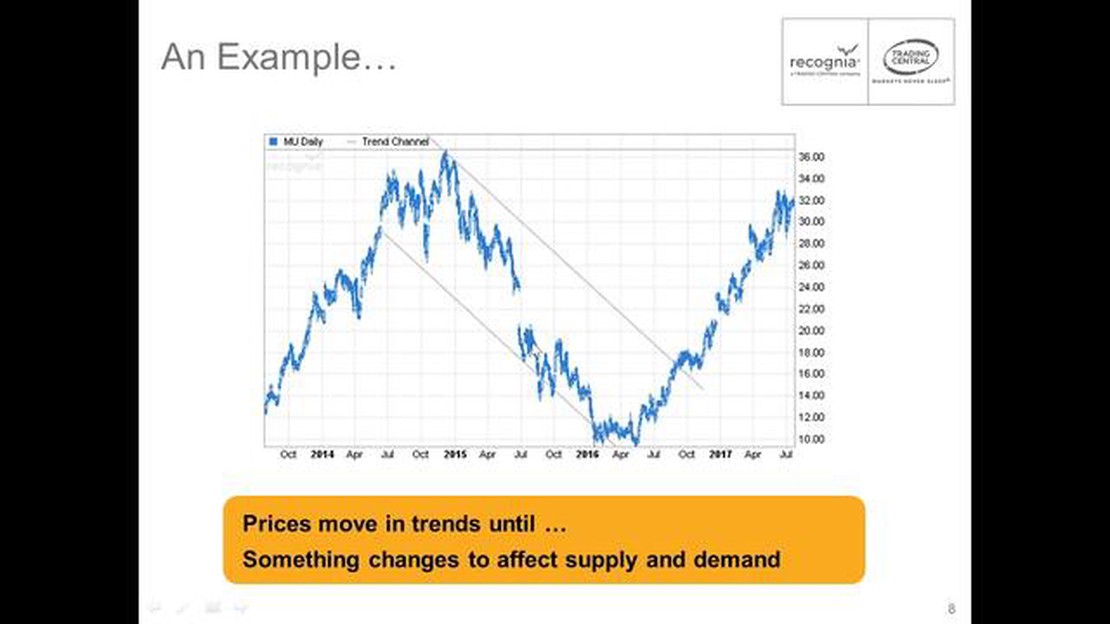
One of the key principles of technical analysis is that historical price and volume data can provide valuable information about the supply and demand dynamics of an ETF. This information can be used to identify support and resistance levels, trend lines, and other indicators that can help investors make decisions about buying or selling an ETF.
For example, a technical analyst might look at a chart of an ETF’s price over a specific time period and notice that the price consistently bounces off a certain support level. This support level becomes an important indicator for the analyst, suggesting that it might be a good time to buy the ETF when the price approaches that level.
In addition to support and resistance levels, technical analysts also rely on other indicators such as moving averages, relative strength index (RSI), and MACD (moving average convergence divergence) to analyze the performance of ETFs. These indicators can help identify potential trend reversals, overbought or oversold conditions, and other signals that can guide investment decisions.
However, it is important to note that technical analysis is not foolproof, and it should not be the sole basis for investment decisions. It is just one tool among many that investors can use to analyze the performance of ETFs. Fundamental analysis, which involves analyzing a company’s financial statements and other qualitative factors, should also be considered.
In conclusion, understanding ETF performance and using technical analysis can provide valuable insights for investors. By studying historical price and volume data and using various indicators, investors can better understand the potential future direction of an ETF’s price. However, it is important to use technical analysis in conjunction with other analytical tools to make well-informed investment decisions.
What is ETF Performance?
An exchange-traded fund (ETF) is a type of investment fund and exchange-traded product, with shares that are traded on a stock exchange. ETFs are designed to track the performance of an underlying index or asset, such as stocks, bonds, commodities, or a combination of these.
The performance of an ETF is a measure of how well it has performed over a specific time period. It takes into account a variety of factors, including the returns generated by the underlying index or asset, as well as any fees or expenses incurred by the ETF.
Investors often look at ETF performance to assess the historical returns and volatility of the fund. This information can help investors evaluate the potential risk and reward associated with investing in the ETF.
ETF performance can be measured using various metrics, such as the total return, which includes both capital appreciation and dividend payments, or the annualized return, which calculates the average annual return over a specific period of time. Other metrics like the Sharpe ratio and standard deviation can also be used to evaluate risk-adjusted returns and volatility.
It’s important to note that past performance is not indicative of future results. While ETF performance can provide valuable insights, it should not be the sole basis for making investment decisions. Other factors, such as the ETF’s investment objectives, strategy, and management team, should also be considered before investing.
In conclusion, ETF performance measures how well an ETF has performed over a specific time period, taking into account factors such as returns, fees, and expenses. Investors use this information to assess the historical returns, volatility, and potential risk associated with investing in the ETF.
FAQ:
What is technical analysis?
Technical analysis is a method of evaluating securities by analyzing statistics generated by market activity, such as past prices and volume. It is used to forecast future price movements based on historical patterns and trends.
Can technical analysis be used to analyze ETF performance?
Yes, technical analysis can be used to analyze ETF performance. ETFs are traded on exchanges just like individual stocks, and their price movements can be analyzed using the same technical analysis tools and indicators.
What are some popular technical analysis tools used to analyze ETF performance?
Some popular technical analysis tools used to analyze ETF performance include moving averages, relative strength index (RSI), MACD (Moving Average Convergence Divergence), and Bollinger Bands.
How can technical analysis help investors make decisions about ETFs?
Technical analysis can help investors make decisions about ETFs by providing insights into the current and future trends of the market. By analyzing price patterns and other indicators, investors can identify potential buying or selling opportunities in ETFs.
Is technical analysis the only method to analyze ETF performance?
No, technical analysis is not the only method to analyze ETF performance. Fundamental analysis, which involves examining a company’s financial statements and industry trends, is another commonly used method to assess the potential performance of ETFs.
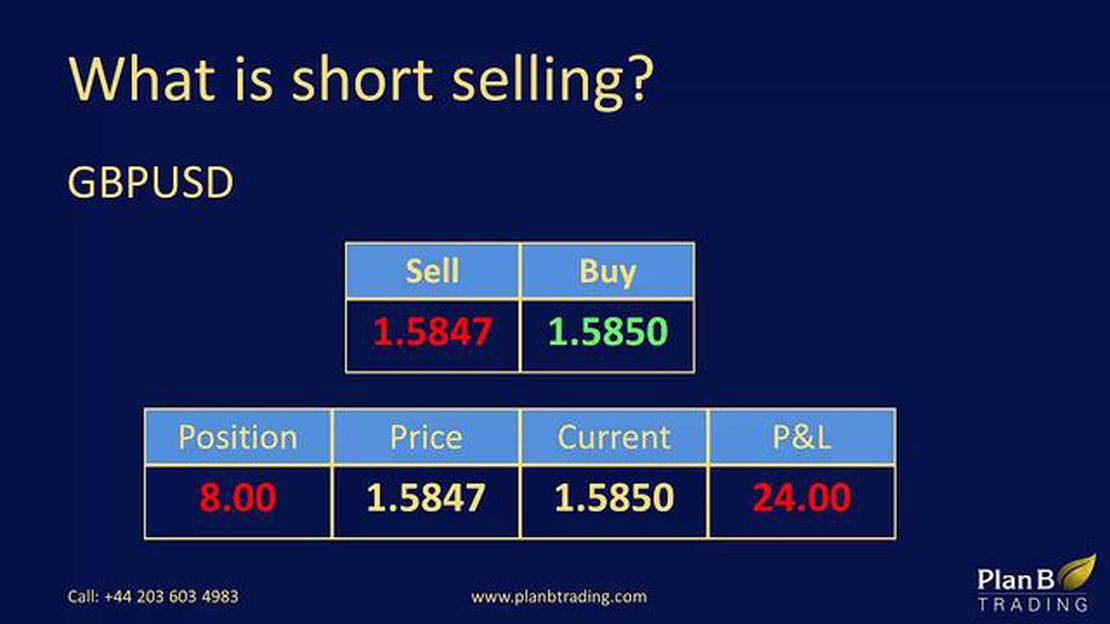
Short Selling Forex: Is it Possible and How Does it Work? Short selling is a common strategy in financial markets, allowing investors to make a profit …
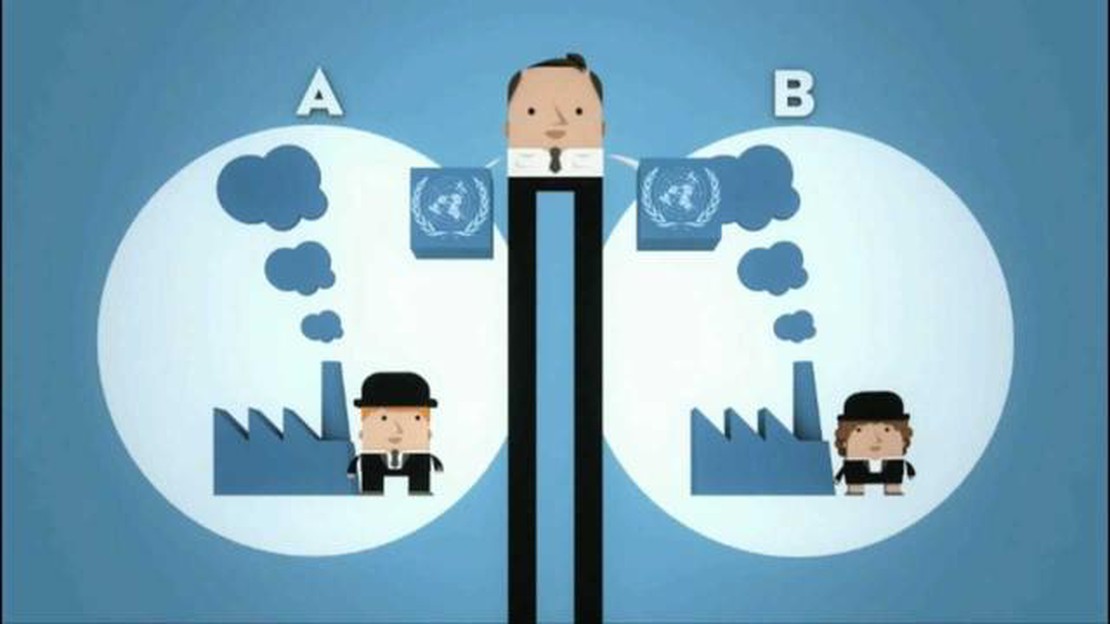
Understanding the Mechanism of an Emissions Trading System Emissions trading systems (ETS) have become an essential policy tool in the global efforts …
Understanding the Differences between Forex and HFX When it comes to trading in the financial markets, two terms that often come up are Forex and HFX. …