


Exploring the Pros and Cons of ESOPs: How Do They Affect Shareholders?
Is ESOP beneficial or detrimental to shareholders? Employee Stock Ownership Plans (ESOPs) have become increasingly popular among businesses as a means …
Read Article
When it comes to investing, one key metric that every investor should be familiar with is the moving average price. This calculation helps to determine the average price of a security over a specified period of time. By understanding this metric, investors can gain valuable insights into the price trends and make well-informed trading decisions.
The moving average price is calculated by taking the sum of a security’s closing prices over a specific period and then dividing it by the number of periods. This period can vary depending on the investor’s preference, with common options being 50, 100, or 200 days. The moving average is constantly recalculated as each new day’s closing price is added, giving investors a dynamic view of the security’s price movement.
Understanding the moving average price can be especially useful in identifying trends and potential buy or sell signals. When the current price of a security rises above its moving average, it may indicate a bullish trend, suggesting that it could be a good time to buy. Conversely, if the current price falls below the moving average, it may signal a bearish trend and could be an indication to sell.
It is important to note that the moving average price should not be relied upon as the sole indicator for making investment decisions. It is just one tool in a larger toolbox of analysis techniques. It is always recommended to use additional indicators and conduct thorough research before making any trading decisions.
In conclusion, calculating the moving average price is a simplified yet powerful method for analyzing trends and making informed investment decisions. By having a good understanding of this metric, investors can gain valuable insights into the overall price movement of a security and potentially improve their trading strategies. However, it is essential to remember that the moving average price should be used in conjunction with other analysis tools and thorough research to ensure the most accurate and informed decision-making.
Calculating the moving average price is a key concept in financial analysis. It provides a way to assess the average price of a security over a specified period of time, allowing traders and investors to make informed decisions.

The moving average price is calculated by taking the sum of the closing prices over a given number of days and dividing it by that same number. This creates a simple average of the prices over the specified time period.
For example, if you were calculating a 10-day moving average price, you would take the sum of the closing prices for the past 10 days and divide it by 10. This would give you the average price for that 10-day period.
One common use of the moving average price is to identify trends in the market. By comparing the current price to the moving average price, traders can determine whether the market is trending upwards or downwards. If the current price is above the moving average, it suggests an upward trend, while if it is below the moving average, it suggests a downward trend.
Read Also: Is Option Trading Closed on Friday? Everything You Need to Know
Another use of the moving average price is to identify support and resistance levels. Support levels are price levels where the price of a security tends to stop falling and start rising, while resistance levels are price levels where the price tends to stop rising and start falling. By comparing the current price to the moving average, traders can identify these important levels.
| Day | Closing Price |
|---|---|
| 1 | 50.32 |
| 2 | 51.23 |
| 3 | 52.10 |
| 4 | 51.75 |
| 5 | 50.62 |
In the table above, you can see an example of closing prices for a 5-day period. To calculate the 5-day moving average price, you would add up these closing prices (50.32 + 51.23 + 52.10 + 51.75 + 50.62 = 256.02) and then divide by 5 to get an average of 51.20.
By understanding how to calculate the moving average price and how to interpret it, traders and investors can gain valuable insights into market trends and levels of support and resistance. This can help them make more informed decisions and improve their chances of success in the financial markets.
The moving average price is a commonly used technical indicator in financial analysis. It is a calculation that helps traders and analysts understand the average price of a security over a specific period of time. This average price is calculated by adding together the closing prices of a security over a set number of time periods and then dividing that sum by the number of time periods.
The moving average price is often used to identify trends and potential trading opportunities. By smoothing out short-term price fluctuations, it can help traders and analysts identify the overall direction of the market. For example, a rising moving average price indicates an upward trend, while a falling moving average price indicates a downward trend.
There are different types of moving averages, including simple moving averages (SMA) and exponential moving averages (EMA). SMA gives an equal weight to each price point in the calculation, while EMA gives more weight to recent prices. Traders and analysts can choose the type of moving average that best suits their trading strategy and time frame.
The moving average price can be plotted on a chart to visually represent the average price over time. This can help traders identify support and resistance levels, as well as potential entry and exit points for trades. Additionally, moving average crossovers, where a shorter-term moving average crosses above or below a longer-term moving average, can be used as buy or sell signals.
Read Also: How long does a forex course last?
In conclusion, the moving average price is a useful tool in financial analysis that helps traders and analysts understand the average price of a security over a specific period of time. By smoothing out short-term price fluctuations, it can provide valuable insights into trends and potential trading opportunities.
The moving average price is a calculated average price of a security or asset over a specific period of time. It is used in technical analysis to identify trends and potential entry or exit points.
The moving average price is calculated by adding up the closing prices of a security over a specified period of time and dividing the sum by the number of periods. This gives you the average price over that period of time.

The moving average price is important for traders because it can help identify trends and provide potential buy or sell signals. It can also act as a support or resistance level for a security, indicating potential price levels that buyers or sellers may act upon.
There are several types of moving averages, including the simple moving average (SMA), exponential moving average (EMA), and weighted moving average (WMA). Each type has its own formula and characteristics, but they all aim to smooth out price data and identify trends.
Yes, the moving average price can be used for different timeframes. Traders can choose to calculate it over short-term periods, such as days or weeks, or over longer-term periods, such as months or years, depending on their trading strategy and goals.
The moving average price is a calculation that helps traders and investors determine the average price of a security over a specific period of time.

Is ESOP beneficial or detrimental to shareholders? Employee Stock Ownership Plans (ESOPs) have become increasingly popular among businesses as a means …
Read Article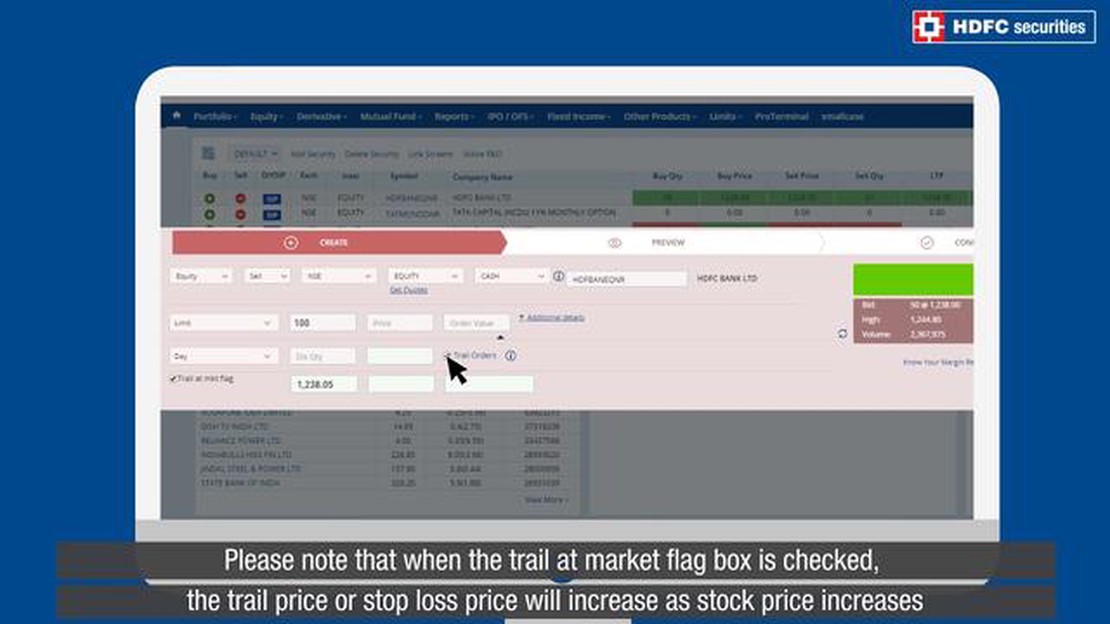
How to set stop loss in option trading with HDFC securities Option trading can be a lucrative investment strategy, but it also involves risks. One way …
Read Article
Best tool for affiliate marketing: A comprehensive guide Affiliate marketing has become one of the most popular ways for individuals and businesses to …
Read Article
Difference between Hi-Point 995 and Hi-Point 995TS: Explained When it comes to firearms, it’s important to understand the specifications and features …
Read Article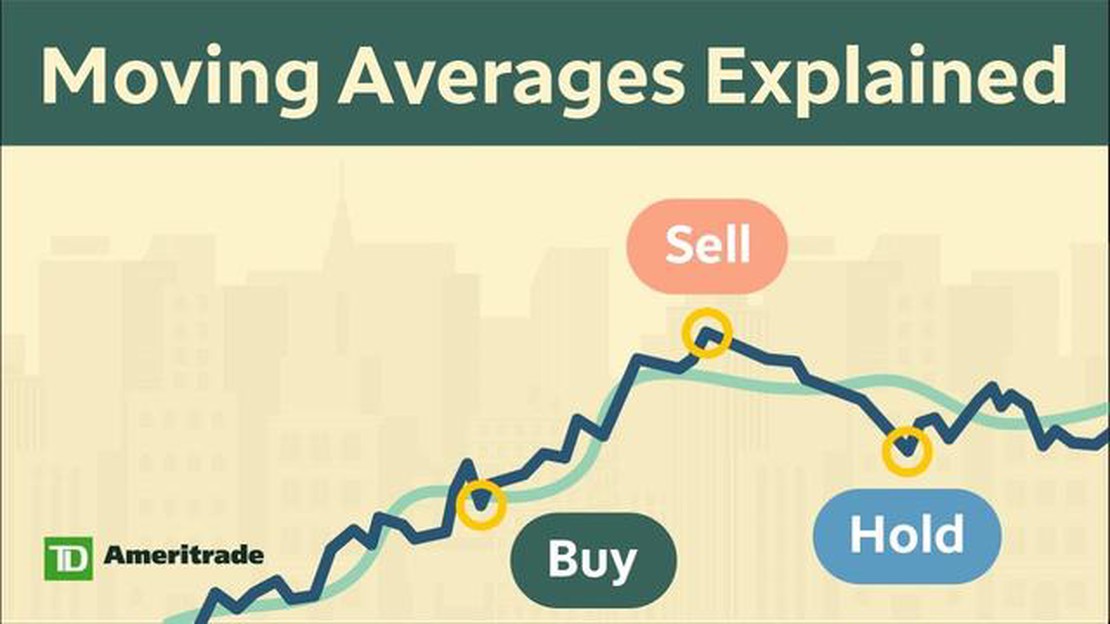
Understanding the Significance of Moving Averages in Trading When it comes to analyzing and forecasting financial markets, one of the most commonly …
Read Article
Tips for becoming a successful CDO Becoming a Chief Data Officer (CDO) is a significant achievement in today’s data-driven world. As a CDO, you play a …
Read Article


