


Discover the Reasons Why People Love Forex Trading
Discover the Reasons Why People Love Forex Trading Forex trading has become an incredibly popular form of investment in recent years, and it’s no …
Read Article

The moving average channel is a popular technical analysis tool that helps traders identify the current trend and potential buying or selling opportunities. By calculating the moving average of a security’s price, traders can determine the market’s overall direction and identify support and resistance levels.
To calculate the moving average channel, traders need to first choose a time period, such as 20 days. They then calculate the average price over that time period by adding up the closing prices for each day and dividing by the number of days. This average is called the simple moving average (SMA).
Once the SMA is calculated, traders can then calculate the upper and lower channels by adding or subtracting a certain number of standard deviations from the SMA. The number of standard deviations depends on the trader’s preference and the volatility of the market. Typically, a common deviation used is 2, which creates a channel that captures approximately 95% of the price movement.
The moving average channel is a powerful tool for traders as it helps them identify when a security is overbought or oversold. When the price reaches the upper channel, it may be a sign that the security is overbought and due for a correction. Conversely, when the price reaches the lower channel, it may indicate that the security is oversold and due for a rebound. By using this information, traders can make informed trading decisions and potentially profit from price fluctuations.
The Moving Average Channel is a technical analysis tool used by traders to identify potential price trends in financial markets. It is based on the concept of a moving average, which is a calculation that smoothes out price data over a specific period of time.
The Moving Average Channel consists of three key components: the upper band, the lower band, and the middle band. The middle band represents the moving average line, which is calculated by taking the average price over a specified period. The upper and lower bands are derived from the middle band using a specified percentage or standard deviation.

Traders use the Moving Average Channel to help determine the overall direction of the market and to identify potential support and resistance levels. When the price moves above the upper band, it may be considered overbought, suggesting a potential reversal or pullback. Conversely, when the price falls below the lower band, it may be considered oversold, indicating a potential reversal or bounce.
| Upper Band | Middle Band | Lower Band | |
|---|---|---|---|
| Definition | The highest point in the Moving Average Channel | The moving average line | The lowest point in the Moving Average Channel |
| Calculation | Middle Band + (Percentage / Standard Deviation) | Simple Moving Average | Middle Band - (Percentage / Standard Deviation) |
| Use | Potential resistance level | Overall trend direction | Potential support level |
The Moving Average Channel can be customized based on the trader’s preferences and the specific market conditions. By adjusting the period length and the percentage or standard deviation used to calculate the upper and lower bands, traders can fine-tune the tool to better suit their trading strategy.
It is important to note that the Moving Average Channel is a lagging indicator, meaning it is based on past price data. As a result, it may not always accurately predict future price movements. Therefore, it is often used in conjunction with other technical analysis tools and indicators to confirm trading signals.
Read Also: Understanding the Spatial Mean in ArcGIS: Definition and Applications
In conclusion, the Moving Average Channel is a versatile tool that can be used by traders to identify potential price trends and levels of support and resistance. By understanding the components of the Moving Average Channel and how to customize it, traders can incorporate it into their trading strategy to make more informed trading decisions.
When calculating the Moving Average Channel, the first step is to choose the appropriate time frame. This refers to the specific period of time over which you want to analyze the price data.
Choosing the right time frame is crucial because it determines the level of detail and accuracy in your analysis. Different time frames can provide different perspectives on the price movement, allowing you to identify short-term or long-term trends.
For example, if you are interested in short-term trading and want to capture quick price movements, you may choose a time frame of minutes or hours. On the other hand, if you are interested in long-term investing and want to analyze the overall market trend, you may choose a time frame of days, weeks, or even months.
Read Also: Understanding Mean Reversion in Trading: Key Concepts and Strategies
Additionally, the choice of time frame should align with your trading or investing strategy. If you prefer a more aggressive approach with frequent trades, a shorter time frame may be more suitable. Alternatively, if you have a longer-term investment horizon and want to avoid excessive trading, a longer time frame may be preferable.
Ultimately, the choice of time frame is subjective and depends on your personal preferences, trading style, and objectives. It is important to experiment with different time frames and see which one best suits your needs and provides the most reliable signals for your trading decisions.
Moving Average Channel is a technical analysis tool that uses the moving average of an asset’s price to determine the upper and lower boundaries of a channel. It helps traders identify potential support and resistance levels and can be used to generate trading signals.
To calculate the Moving Average Channel, you need to first calculate the moving average of the asset’s price using a chosen period. Then, you calculate the upper channel line by adding a chosen percentage to the moving average, and the lower channel line by subtracting the same percentage from the moving average. The result is a channel that represents the potential upper and lower boundaries of the asset’s price movement.

The purpose of the Moving Average Channel is to help traders identify potential support and resistance levels. It can be used to determine when prices are nearing the upper or lower boundaries of the channel, which may indicate a potential trend reversal or breakout. Traders can use this information to make informed decisions about buying or selling an asset.
The chosen period and percentage in calculating the Moving Average Channel determine the sensitivity of the channel lines. A shorter period and percentage will result in a narrower channel with more frequent breaks, while a longer period and percentage will result in a wider channel with fewer breaks. Traders need to consider their trading strategy and risk tolerance when selecting these parameters.
Yes, there are some limitations to using the Moving Average Channel. It is a lagging indicator, which means it may not provide timely signals for fast-moving markets. It is also not foolproof and can produce false signals. Traders should use it in conjunction with other technical analysis tools and consider market conditions and other factors before making trading decisions.
Calculating the Moving Average channel involves determining the average price of a security over a specific time period and then plotting two lines above and below this average. To calculate the Moving Average channel, you first need to choose the time period for the Moving Average. Then, calculate the average price over this time period by adding up the closing prices and dividing by the number of periods. Next, calculate the upper line of the channel by adding the standard deviation of the price to the Moving Average, and calculate the lower line by subtracting the standard deviation from the Moving Average. Finally, plot the Moving Average, upper line, and lower line on a chart to visualize the channel.

Discover the Reasons Why People Love Forex Trading Forex trading has become an incredibly popular form of investment in recent years, and it’s no …
Read Article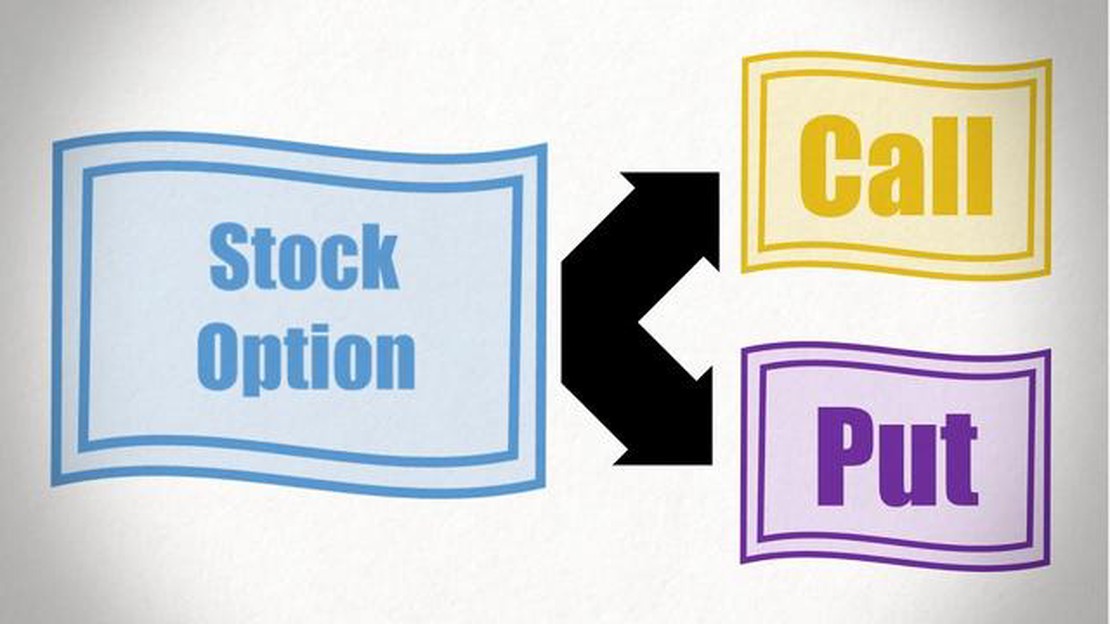
Understanding the mechanics of a stock option agreement Stock option agreements can be a complex and often misunderstood aspect of corporate finance. …
Read Article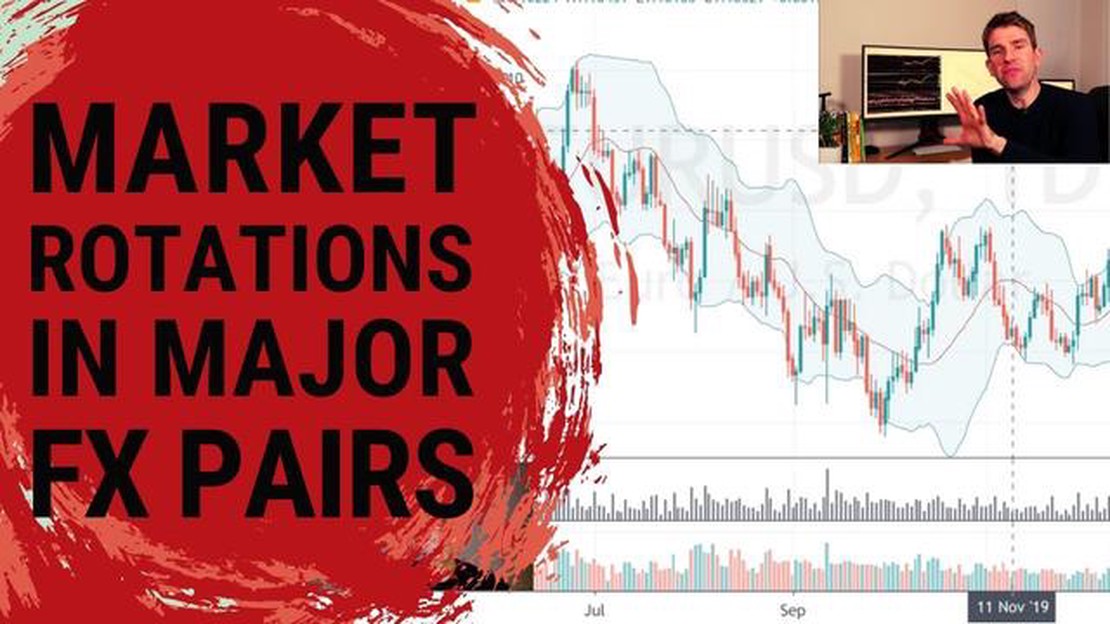
The most range bound forex pairs In the forex market, currencies are constantly fluctuating in value against one another. However, there are certain …
Read Article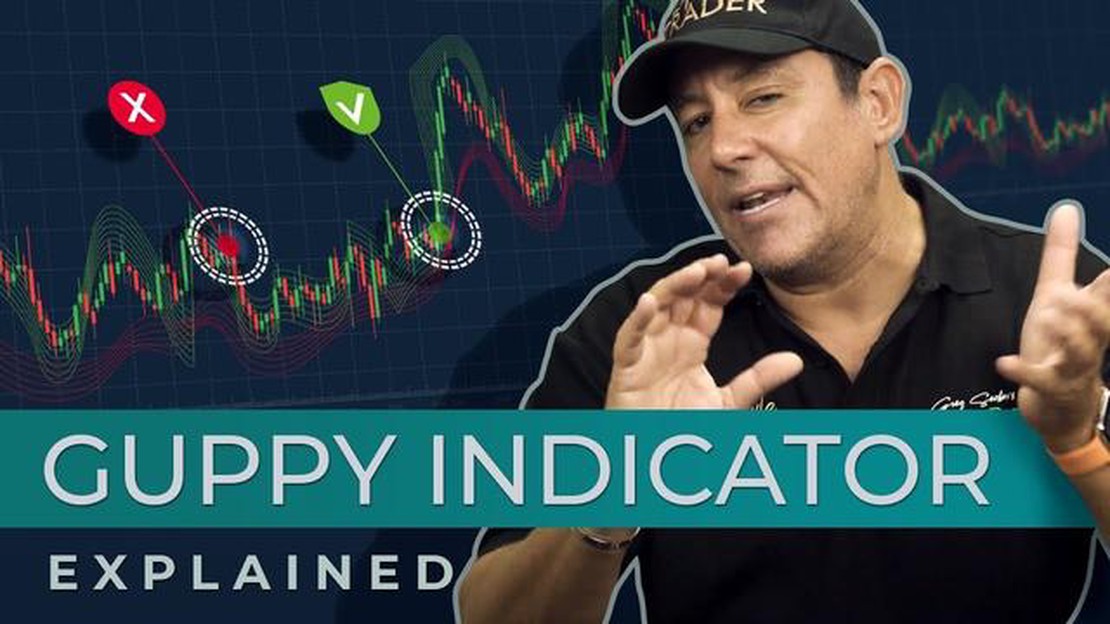
Identifying patterns indicating strength in a stock using Guppy charts Investing in the stock market can be a daunting task, especially for novice …
Read Article
Understanding the Daily Spot Rate When it comes to international trade and finance, the daily spot rate is a crucial concept to understand. It is an …
Read Article
Understanding the Importance of a Gain Report Gain reports are an essential tool for businesses and individuals who want to understand their financial …
Read Article


