

Will Forex Trading Survive? The Future of Forex Trading Explained
Is the end of Forex Trading approaching? In the ever-evolving world of finance, forex trading has been a constant presence for decades. Trillions of …
Read Article
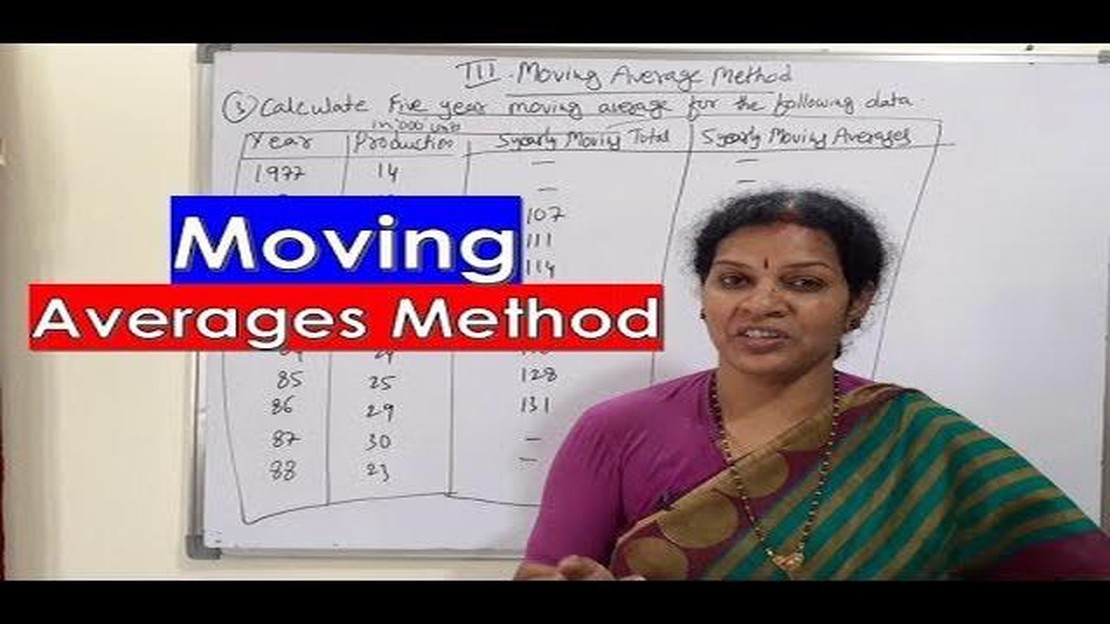
When it comes to analyzing financial data, moving averages are a commonly used tool. They can help identify trends, smooth out volatility, and provide valuable insights into market behavior. In this step-by-step guide, we will walk you through the process of calculating a moving average trend.
First and foremost, let’s define what a moving average is. A moving average is a calculation that takes the average of a series of data points over a specified time period. It is called “moving” because it is constantly updated as new data becomes available, thus providing a smoothed-out representation of the underlying trend.
Calculating a moving average involves a few simple steps. First, determine the time period over which you want to calculate the average. This could be days, weeks, months, or any other time frame that is relevant to your analysis. Next, gather the data points for the selected time period. These data points could be stock prices, sales figures, or any other numerical data that you want to analyze. Once you have the data points, add them up and divide the sum by the number of data points to find the average.
Here’s an example:
Let’s say you want to calculate the 10-day moving average of a stock’s closing prices. You gather the closing prices for the past 10 days, add them up, and divide the sum by 10. This will give you the average closing price over the 10-day period.
To visualize the moving average trend, you can plot the calculated values on a graph. This will help you see how the trend evolves over time. By comparing the moving average to the actual data points, you can identify instances where the trend is changing or diverging from the actual data, which may indicate a potential market shift.
Overall, calculating a moving average trend is a valuable tool for analyzing financial data. It can help investors make informed decisions, identify potential risks or opportunities, and understand the underlying trends in the market. By following this step-by-step guide, you’ll be ready to apply moving averages to your own analysis and enhance your understanding of market behavior.

Moving averages are a widely used tool in technical analysis and are often used to identify trends in financial markets. They are calculated by taking the average of a series of data points over a specified time period, and are commonly used to smooth out short-term fluctuations and highlight longer-term trends.
There are different types of moving averages, including simple moving averages (SMA) and exponential moving averages (EMA). The main difference between the two is in the way they weight the data points. SMAs give equal weight to all data points in the time period, whereas EMAs give more weight to recent data points.
Moving averages are typically displayed on a price chart and are often used as a signal to buy or sell a security. When the price of an asset is above its moving average, it is considered to be in an uptrend, whereas when the price is below its moving average, it is considered to be in a downtrend. Traders often use the crossover of two moving averages as a signal to enter or exit a trade.
Read Also: How to effectively use two moving average indicators
| Simple Moving Average (SMA) | Exponential Moving Average (EMA) |
|---|---|
| Calculated by taking the average of a specified number of data points | Weights recent data points more heavily |
| Smooths out short-term fluctuations | More responsive to recent price changes |
| Gives equal weight to all data points | Gives more weight to recent data points |
In conclusion, moving averages are a powerful tool for identifying trends in financial markets. By calculating the average price of an asset over a specified time period, they can help smooth out short-term fluctuations and provide a clearer picture of the overall trend. Whether you prefer simple moving averages or exponential moving averages, incorporating them into your trading strategy can help improve your decision-making process.
Before you can start calculating the moving average trend, you need to choose a timeframe for your analysis. The timeframe refers to the period over which you want to calculate the moving average.
The choice of timeframe depends on the specific purpose of your analysis. If you are interested in short-term trends, you might choose a timeframe of a few days or weeks. On the other hand, if you are interested in long-term trends, you might choose a timeframe of several months or even years.
It is important to note that the choice of timeframe can have a significant impact on the interpretation of the moving average trend. A shorter timeframe will be more sensitive to short-term price fluctuations, while a longer timeframe will be more focused on long-term trends.
When choosing a timeframe, it is also important to consider the frequency of your data. If you have daily price data, you might choose a timeframe of 10 or 20 days. If you have weekly price data, you might choose a timeframe of 5 or 10 weeks. The goal is to find a timeframe that captures the relevant trends in your data without being too sensitive to noise.
Once you have chosen a timeframe, you can move on to the next step of the process, which is calculating the actual moving average.
Once you have gathered the necessary data, the next step is to calculate the moving average. The moving average is a commonly used statistical calculation that is used to analyze trends over a specific time period.
Read Also: Who is the Wealthiest Trader in India? Discover the Top Earners in the Indian Trading Industry
To calculate the moving average, follow these steps:
Calculating the moving average can help you identify trends in your data, as it smooths out any short-term fluctuations. It can be particularly useful in financial analysis to identify long-term trends in stock prices or other market indicators.
Once you have calculated the moving average, you can plot it on a graph to visualize the trend over time. This can help you make informed decisions about future predictions or investment strategies.

In the next step, we will discuss how to interpret the moving average and use it to make predictions.
Calculating moving average trend is important in finance because it helps to identify the direction of a stock price or market trend over a given period of time. It can be used to generate buy or sell signals, and it provides a smoother representation of price movements, which can help to filter out noise and identify long-term trends.
The moving average trend is calculated by taking the average of a selected number of price points over a specific period of time. The calculation involves adding up the prices and dividing by the number of points to get an average. This average is then plotted on a chart to show the trend over time.
The simple moving average (SMA) and the exponential moving average (EMA) are both methods used to calculate moving average trends. The difference is that the SMA gives equal weight to all price points in the calculation, while the EMA gives more weight to recent price points. This means that the EMA responds more quickly to recent price changes, while the SMA provides a smoother, slower-moving trend line.
The moving average trend is not a standalone indicator for predicting future price movements. It is best used as part of a broader set of technical analysis tools and indicators. However, it can be used to provide an indication of the overall direction of a market or stock price, which can help traders and investors make more informed decisions.
Common time periods used for calculating moving average trends include 50-day, 100-day, and 200-day averages. These time periods are often used in technical analysis to provide a longer-term view of price trends. However, the specific time period used will depend on the trading strategy and timeframe of the individual trader or investor.

Is the end of Forex Trading approaching? In the ever-evolving world of finance, forex trading has been a constant presence for decades. Trillions of …
Read Article
Understanding the Role of Forex Broker IB in Online Trading Forex trading is a complex and competitive industry, and finding the right broker to suit …
Read Article
Should I invest in WMT? Investing in the stock market can be a daunting task, especially for beginners. With so many companies and investments to …
Read Article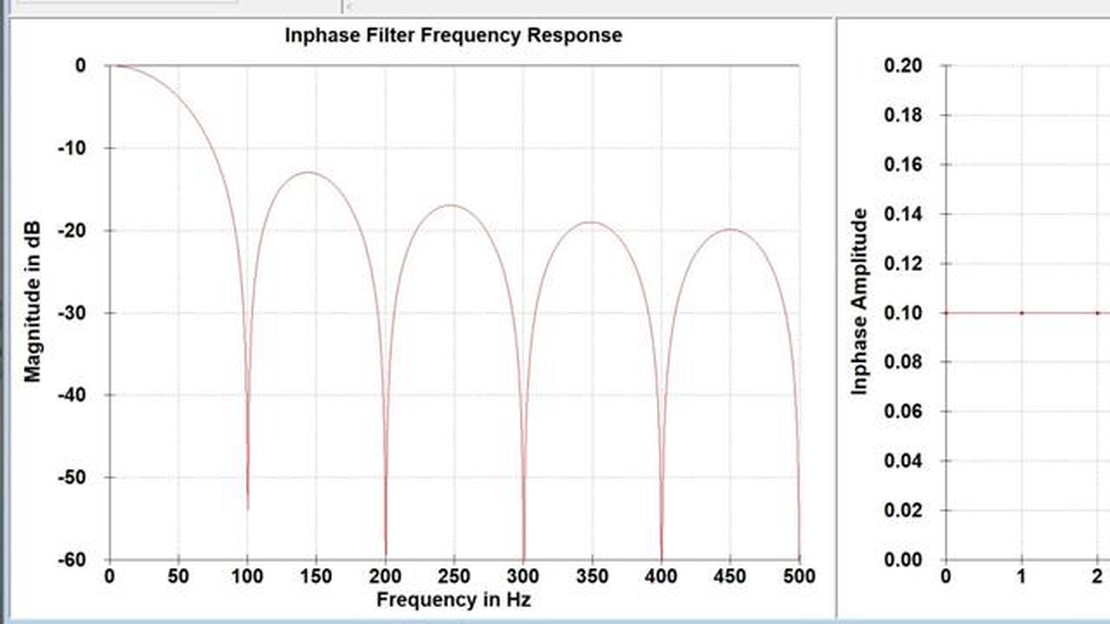
What is the Response of a Moving Average Filter? A moving average filter is a commonly used technique in signal processing to smooth out or reduce …
Read Article
Combining RSI with Bollinger Bands for Effective Technical Analysis The Relative Strength Index (RSI) and Bollinger Bands are two popular technical …
Read Article
Elements of an Insolvent Trading Claim In the world of business, insolvency is an unfortunate reality that many companies face. When a company becomes …
Read Article


