
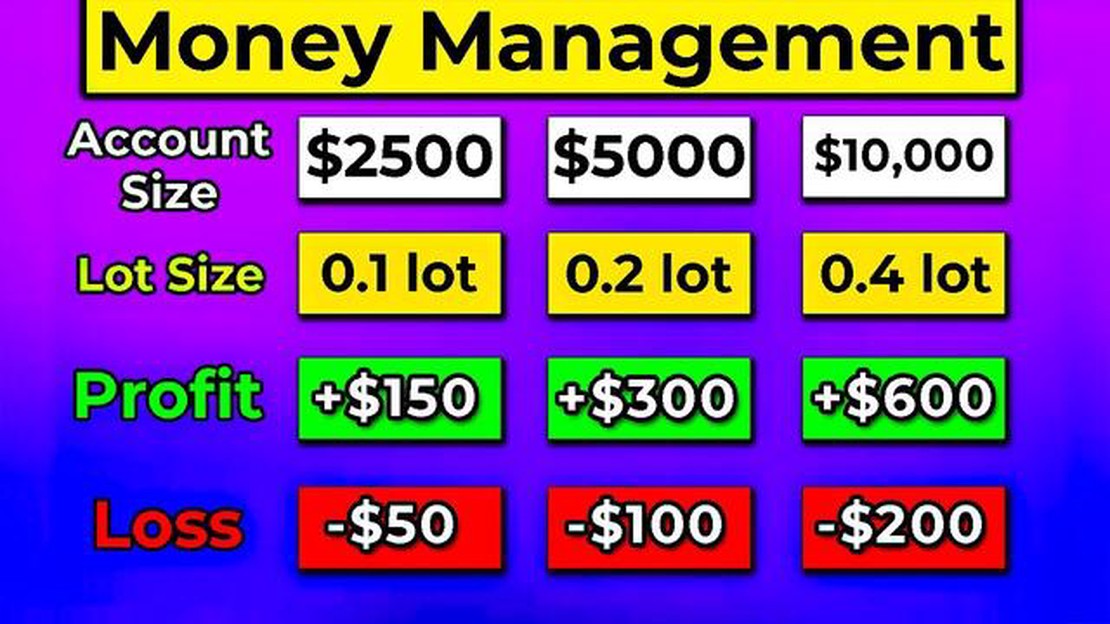

Understanding the Importance of Position Ratio in Forex Trading
Understanding the Position Ratio in Forex Trading In the world of forex trading, understanding the importance of position ratio is crucial for …
Read Article
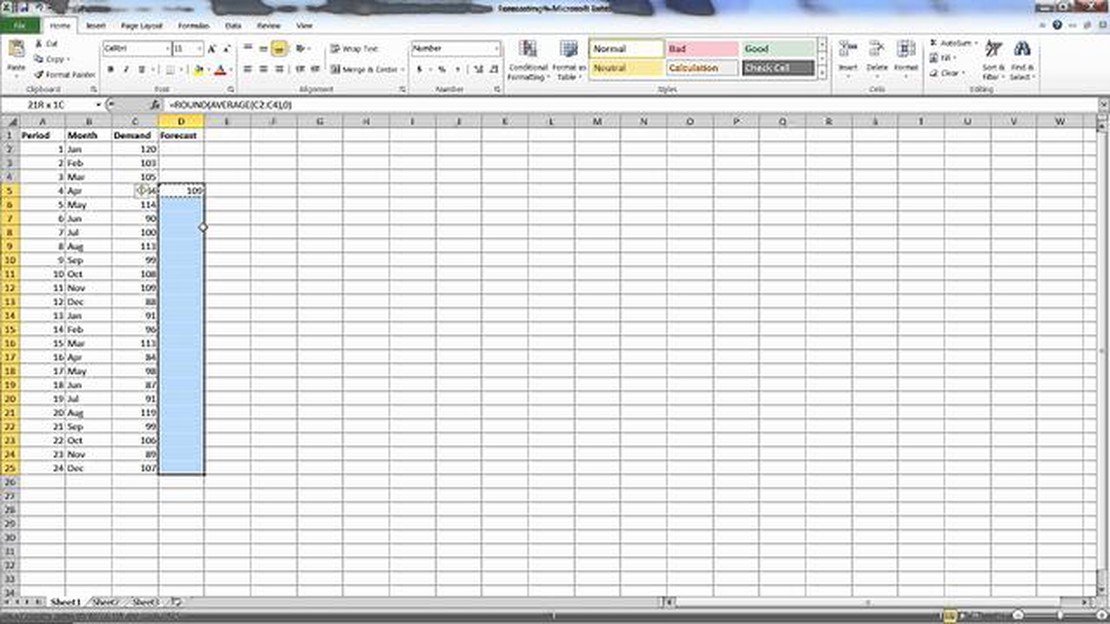
When it comes to making accurate predictions based on historical data, the moving average forecast is a commonly used tool in Excel. By smoothing out fluctuations and identifying trends, this technique can help businesses make informed decisions and plan for the future.
To calculate the moving average forecast in Excel, you’ll need a set of historical data and a specified time period for the moving average. This time period indicates the number of data points used to calculate the average. The longer the time period, the smoother the forecast, but the slower it reacts to changes. Conversely, a shorter time period provides a more responsive forecast, but may be affected by short-term fluctuations.
The first step is to organize your data in Excel, with the time series in one column and the corresponding values in another. Then, select a range of cells where you want to display the moving averages. In the cell next to the first data point, use the AVERAGE function to calculate the average of the specified time period. Drag the fill handle to apply this formula to the remaining cells for the entire time series.
Once you’ve calculated the moving averages, you can visualize the forecast by creating a line chart. Select the range of cells containing both the time series data and the moving averages, and insert a line chart. This will help you identify any trends or patterns in the forecast, allowing you to make more accurate predictions and plan accordingly.
By following this step-by-step guide, you can easily calculate the moving average forecast in Excel and utilize this valuable tool to make informed business decisions. Regardless of your industry or the size of your organization, having accurate forecasts is crucial for success, and Excel provides a user-friendly platform to achieve this goal.
Moving average forecast is a technique used in data analysis and forecasting to identify trends and patterns in a dataset. It involves calculating the average value of a subset of data points over a specified period of time, and using this average to predict future values.

The moving average forecast helps to smooth out fluctuations and noise in the data, making it easier to identify underlying trends and make predictions. It is commonly used in finance, economics, and other fields to analyze and predict stock prices, sales trends, demand for products, and other time-dependent variables.
To calculate a moving average forecast, you need to choose a window size, which is the number of data points used to calculate the average. The window size depends on the frequency of the data and the desired level of smoothing. A smaller window size provides a more responsive forecast, but it may also be more susceptible to noise and fluctuations. A larger window size provides a smoother forecast, but it may also lose some of the finer details of the data.
Once you have chosen the window size, you calculate the average of the data points within the window by adding them up and dividing by the window size. This average is then used as the forecast for the next time period. As new data becomes available, the window moves forward, dropping the oldest data point and adding the newest data point. The forecast is recalculated using the updated window.
The moving average forecast is a simple yet powerful technique that can be easily implemented in Excel and other spreadsheet programs using formulas and functions. By analyzing historical data and making predictions based on moving averages, businesses and individuals can make informed decisions, plan for the future, and improve their overall forecasting accuracy.
Read Also: Is SMA the same as DMA? Know their differences and similarities
The moving average is a commonly used statistical calculation in forecasting and data analysis. It is a technique that helps in identifying trends and patterns in a dataset by smoothing out variations and fluctuations.
The moving average forecast is used in various fields and industries, including finance, economics, and sales forecasting. It helps in predicting future values based on historical data, providing a clearer picture of the overall trend and helping in decision making.
The purpose of calculating the moving average forecast is to alleviate the impact of short-term fluctuations in the data and highlight the long-term trends. By averaging out the data over a specific time period, it becomes easier to identify the underlying patterns and make predictions about the future.
The moving average forecast is particularly useful when the data contains irregular and unpredictable variations. It smooths out these fluctuations, allowing analysts to focus on the core trend and make more accurate predictions.
Overall, the moving average forecast is a valuable tool in data analysis that helps in making informed decisions, identifying trends, and forecasting future values based on past performance.
Moving average is a widely used forecasting technique in Excel to analyze trends over a specific time period. By calculating the moving averages, you can make predictions and identify patterns in the data.
Read Also: Top Forex Platforms: Find the Best One for Your Trading Needs
To calculate the moving average forecast in Excel, follow these steps:
Alternatively, you can use the “AVERAGE” function directly in a cell. Simply click on the cell where you want to display the moving average, enter the formula “=AVERAGE(range)” (where “range” is the range of cells representing the time period), and press “Enter” to calculate and display the moving average.
It is important to note that the moving average forecast is based on historical data and cannot predict future values accurately. However, it can provide valuable insights into trends and patterns that can aid in decision-making.
By following these simple steps, you can calculate the moving average forecast in Excel and use it to analyze and forecast trends in your data.

Moving average forecast is a technique used in time series analysis to predict future values based on the average of past observations over a specified time period.
You can calculate moving average forecast in Excel by using the AVERAGE function in combination with the OFFSET function to dynamically adjust the range of cells being averaged.
Yes, you can use moving average forecast to predict sales for your business. By analyzing past sales data and calculating the moving average forecast, you can gain insights into potential future sales trends and make informed business decisions.
Yes, there are limitations of using moving average forecast. It tends to smooth out short-term fluctuations and may not accurately capture sudden changes or outliers in the data. Additionally, the accuracy of the forecast may decrease as the time period for the moving average increases, as it may not reflect current market conditions.
A moving average forecast is a statistical technique used to analyze and predict future values based on the average of a certain number of past data points. It helps identify trends and patterns in data.

Understanding the Position Ratio in Forex Trading In the world of forex trading, understanding the importance of position ratio is crucial for …
Read Article
Should I invest in WMT? Investing in the stock market can be a daunting task, especially for beginners. With so many companies and investments to …
Read Article
Is Forex Trading Risky: Understanding the Risks and Rewards Forex trading, also known as foreign exchange trading, is the process of buying and …
Read Article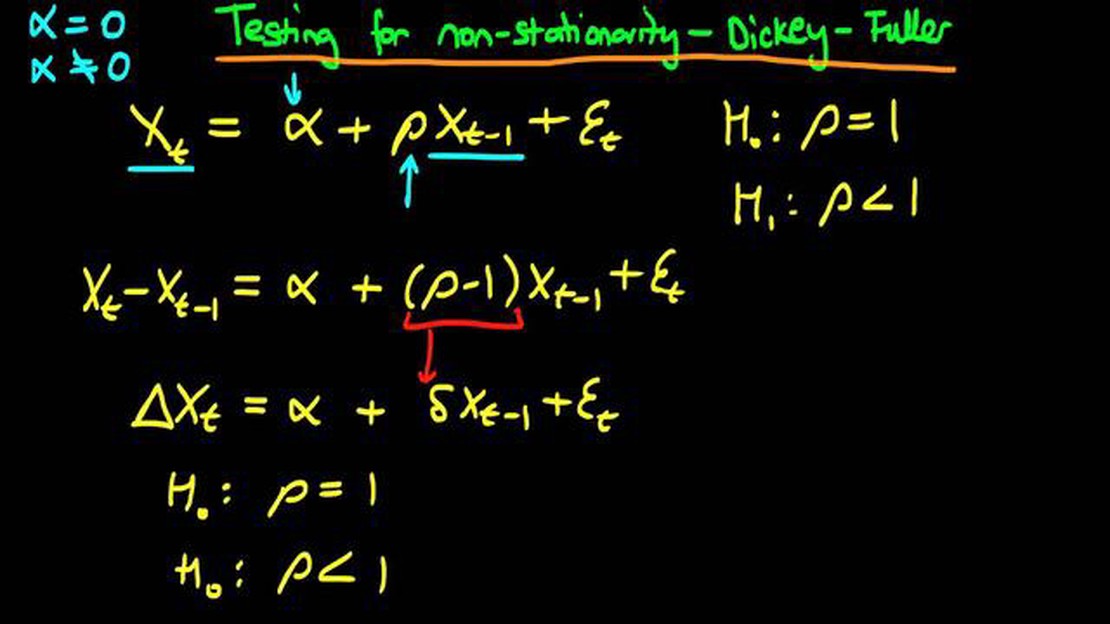
Exploring the 4 unit root tests When analyzing time series data, it is essential to determine if the data exhibits a unit root. A unit root indicates …
Read Article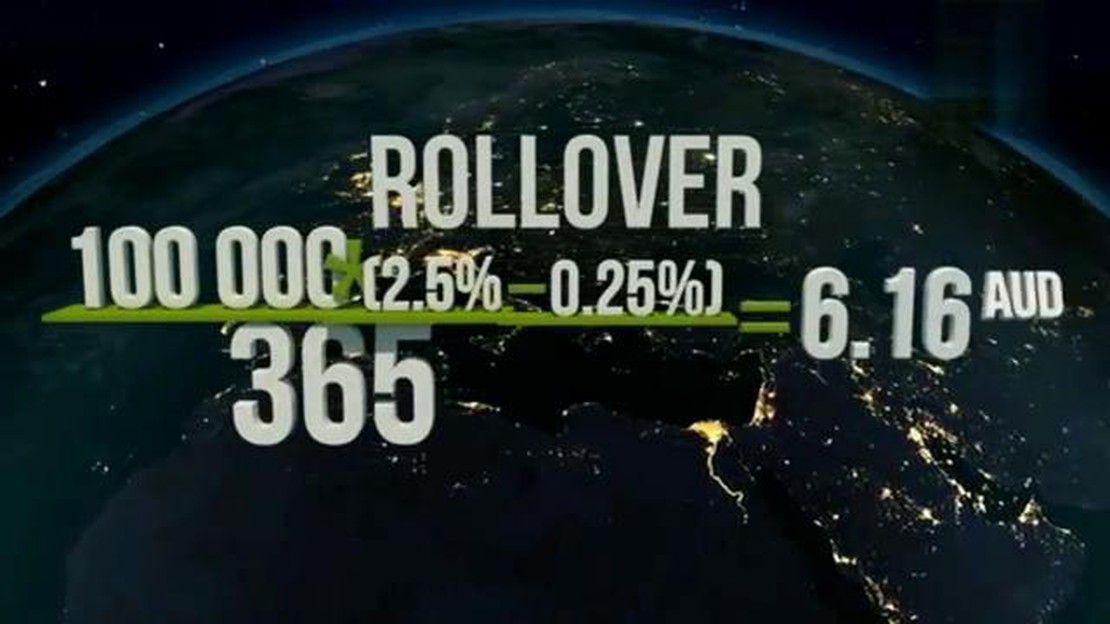
How do you roll forward FX? In the world of foreign exchange (FX) trading, one strategy that often comes up is rolling forward FX. This strategy is …
Read Article
Choosing the Best Time Frame for the 50 EMA Indicator When it comes to technical analysis in trading, the choice of time frame is crucial. Traders use …
Read Article


