

Step-by-Step Guide: How to Trade on IG Index | Expert Tips and Strategies
Trading on IG Index: A Comprehensive Guide Welcome to our step-by-step guide on how to trade on IG Index. Whether you’re a beginner or an experienced …
Read Article
When it comes to the stock market, understanding key indicators can make all the difference in successful trading. One such indicator is the SPX 200 Ma, or the Standard & Poor’s 200-day moving average. This powerful tool is used by traders and investors to analyze market trends and make informed decisions.
The SPX 200 Ma is a technical analysis tool that calculates the average price of a security over a 200-day period. It helps to smoothen out short-term fluctuations and gives a clearer picture of the long-term trend. Traders use this moving average to identify potential buy or sell opportunities.
Why is the SPX 200 Ma important? By analyzing whether the price of a security is above or below its 200-day moving average, traders can determine if the market is in an uptrend or a downtrend. If the price is consistently above the moving average, it indicates a bullish trend, while a price below the moving average signals a bearish trend.
Using the SPX 200 Ma, traders can confirm their analysis and make more accurate predictions about the future movement of a stock. This key indicator acts as a guide, helping traders navigate the complexities of the stock market.
Different traders may have varying strategies when using the SPX 200 Ma. Some may use it as a signal to enter or exit the market, while others may use it to confirm trends identified by other indicators. The SPX 200 Ma is a versatile tool that can be used in conjunction with other technical analysis tools to improve trading accuracy.
SPX 200 Ma refers to the Simple Moving Average (SMA) of the S&P 500 index over a period of 200 trading days. The S&P 500 is a widely followed stock market index that includes the 500 largest publicly traded companies in the United States. The SMA is a technical indicator used by traders and investors to assess the overall trend and direction of the market. It is calculated by adding up the closing prices of the index over a specified period and then dividing that sum by the number of periods.
The SPX 200 Ma is often used as a long-term trend indicator. It is considered a significant level of support or resistance, depending on whether the index is trading above or below it. Traders and investors often pay close attention to the SPX 200 Ma to help identify potential buying or selling opportunities. When the index is trading above its 200-day moving average, it is generally seen as a bullish signal, indicating that the market is in an uptrend. Conversely, when the index is trading below its 200-day moving average, it is generally seen as a bearish signal, indicating that the market is in a downtrend.
It is important to note that the SPX 200 Ma is just one tool in a trader or investor’s toolkit. It should be used in conjunction with other technical and fundamental analysis tools to make well-informed trading or investment decisions. Additionally, it is not a foolproof indicator and can sometimes produce false signals. Therefore, it is important to use caution and consider other factors before making trading or investment decisions based solely on the SPX 200 Ma.

In summary, the SPX 200 Ma is a technical indicator that represents the Simple Moving Average of the S&P 500 index over a period of 200 trading days. It is used by traders and investors to assess the overall trend and direction of the market and can be a significant level of support or resistance. However, it should be used in combination with other analysis tools and should not be relied upon solely for trading or investment decisions.
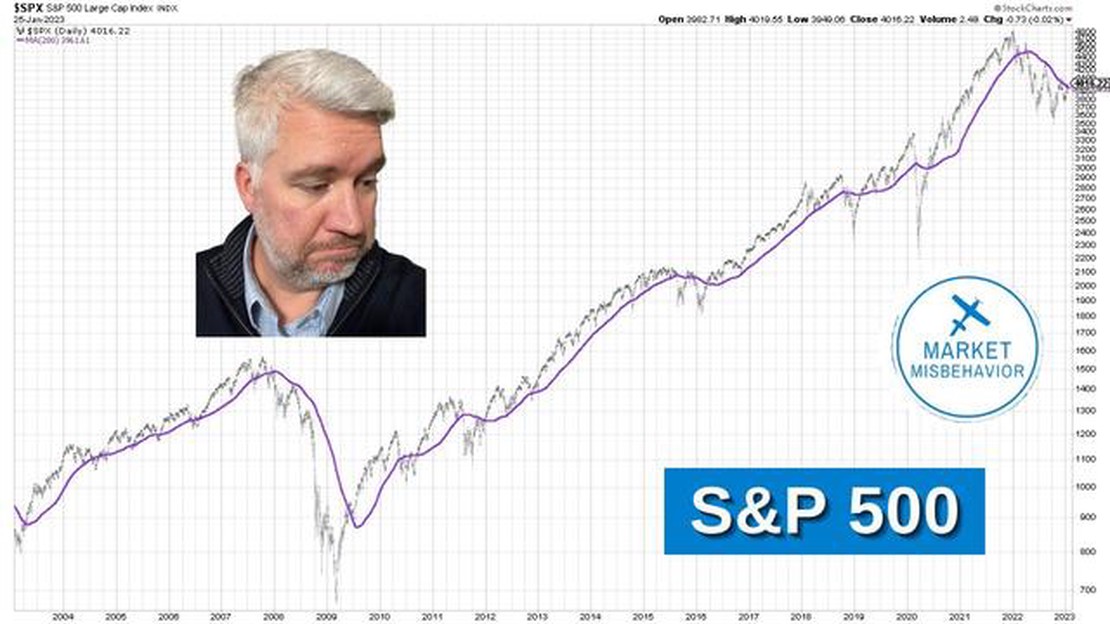
The SPX 200 Ma, also known as the S&P 500 200-day moving average, is a commonly used technical indicator in the world of stock trading. It is used by analysts and investors to gauge the overall trend and direction of the stock market.
The 200-day moving average is calculated by taking the average price of the S&P 500 over the past 200 trading days. This average is then plotted on a chart, creating a line that represents the average price over that time period. By looking at this line, traders can get a clear picture of how the market has been performing over the past several months.
Read Also: Can You Grow a $100 Dollar Forex Account? Tips and Strategies
So why is the SPX 200 Ma important? Well, it is believed to be a good indicator of the long-term trend of the stock market. When the market is trading above its 200-day moving average, it is generally considered to be in an uptrend. Conversely, when the market is trading below its 200-day moving average, it is considered to be in a downtrend.
Traders use the SPX 200 Ma to help identify potential entry and exit points for their trades. For example, if the market is in an uptrend and the price of a stock crosses above its 200-day moving average, it may be seen as a bullish signal to buy. On the other hand, if the market is in a downtrend and the price of a stock crosses below its 200-day moving average, it may be seen as a bearish signal to sell.
It’s important to note that the SPX 200 Ma is just one tool in a trader’s toolbox. It should not be used in isolation and should be used in conjunction with other indicators and analysis techniques. Additionally, it’s important to keep in mind that no indicator is foolproof and there is always some degree of risk involved in trading.
In conclusion, the SPX 200 Ma is a widely used indicator in stock trading that helps traders gauge the long-term trend of the market. By understanding how to interpret this indicator, traders can make more informed trading decisions and potentially increase their chances of success.
The SPX 200 Ma is a widely followed technical indicator in the financial markets. It plays a crucial role in determining the overall health and trend of the S&P 500 index, which is considered a benchmark for the U.S. stock market. The 200 Ma, also known as the 200-day moving average, is a long-term trend indicator that smooths out short-term fluctuations in stock prices.
One of the main reasons why the SPX 200 Ma is important is because it helps investors and traders identify the direction of the market. When the S&P 500 index is trading above its 200-day moving average, it is generally considered to be in an uptrend, indicating that the overall market sentiment is bullish. Conversely, when the index is trading below its 200-day moving average, it is seen as being in a downtrend, signaling bearish market sentiment.
Furthermore, the SPX 200 Ma also acts as a level of support and resistance for the S&P 500 index. When the index declines towards its 200-day moving average, it often finds support at this level and bounces back up. On the other hand, when the index rallies towards its 200-day moving average, it tends to face resistance and may struggle to break above it.
The SPX 200 Ma is also used as a tool for risk management. Many traders use it to determine their entry and exit points in the market. For example, a trader may decide to enter a long position when the S&P 500 index crosses above its 200-day moving average, as this could signal the start of an uptrend. Conversely, a trader may consider exiting a long position or entering a short position when the index falls below its 200-day moving average, as this could indicate a trend reversal.
Read Also: Find out Nedbank's international transfer fees
Overall, the SPX 200 Ma is an important technical indicator that provides valuable insights into the overall health and trend of the S&P 500 index. It helps investors and traders make informed decisions and manage their risk in the market.
| Key Points | Significance |
|---|---|
| Long-term trend indicator | Smooths out short-term fluctuations |
| Identifies market direction | Uptrend or downtrend |
| Acts as support and resistance | Level for bounces and breakouts |
| Used for risk management | Entry and exit points |
SPX 200 Ma stands for S&P 500 Index 200-day Moving Average. It is a commonly used technical indicator that measures the average closing price of the S&P 500 Index over the past 200 days. It is used to identify trends and potential support or resistance levels in the market.

SPX 200 MA is calculated by adding up the closing prices of the S&P 500 Index for the past 200 days and then dividing the sum by 200. This calculation is done on a daily basis to track the trend of the index over a longer period of time.
When the SPX 200 MA is above the current price, it suggests that the market is in a downtrend or that the current price may be overvalued. Traders and investors may interpret this as a bearish signal and consider selling or taking short positions.
When the SPX 200 MA is below the current price, it indicates that the market is in an uptrend or that the current price may be undervalued. Traders and investors may view this as a bullish signal and consider buying or taking long positions.
SPX 200 MA is widely regarded as a reliable indicator by many traders and investors. It is often used in conjunction with other technical indicators and analysis tools to confirm or validate signals. However, it is important to note that no indicator is foolproof and should be used in conjunction with other forms of analysis.
SPX 200 Ma refers to the 200-day moving average of the S&P 500 index. It is a widely followed technical indicator used by traders and investors to assess the overall trend and momentum of the stock market.
The SPX 200 Ma is calculated by taking the average closing prices of the S&P 500 index over the past 200 trading days. It is a simple moving average, which means that each day, the oldest price in the calculation is dropped and the newest price is added.

Trading on IG Index: A Comprehensive Guide Welcome to our step-by-step guide on how to trade on IG Index. Whether you’re a beginner or an experienced …
Read Article
Choosing the Best EA Builder for MT4: A Comprehensive Guide Do you want to automate your trading strategies and make your trading experience more …
Read Article
Trade Forex the Halal Way: A Guide for Muslims Forex trading, also known as foreign exchange trading, is a popular financial market where individuals …
Read Article
How to Check Forex Factory News Forex Factory is a popular website among forex traders that provides up-to-date news and information about the forex …
Read Article
Is the stock market risk-free? Investing in the stock market can be an exciting and potentially lucrative endeavor. Many people are enticed by the …
Read Article
Why do trading firms use FPGAs? Trading firms are constantly seeking innovative ways to gain a competitive edge in the fast-paced and dynamic world of …
Read Article

