


Steps to Recover Lost Funds from Binary Options Trading
How to recover lost funds from binary options? Binary options trading can be a highly risky endeavor, and many people have found themselves in a …
Read Article
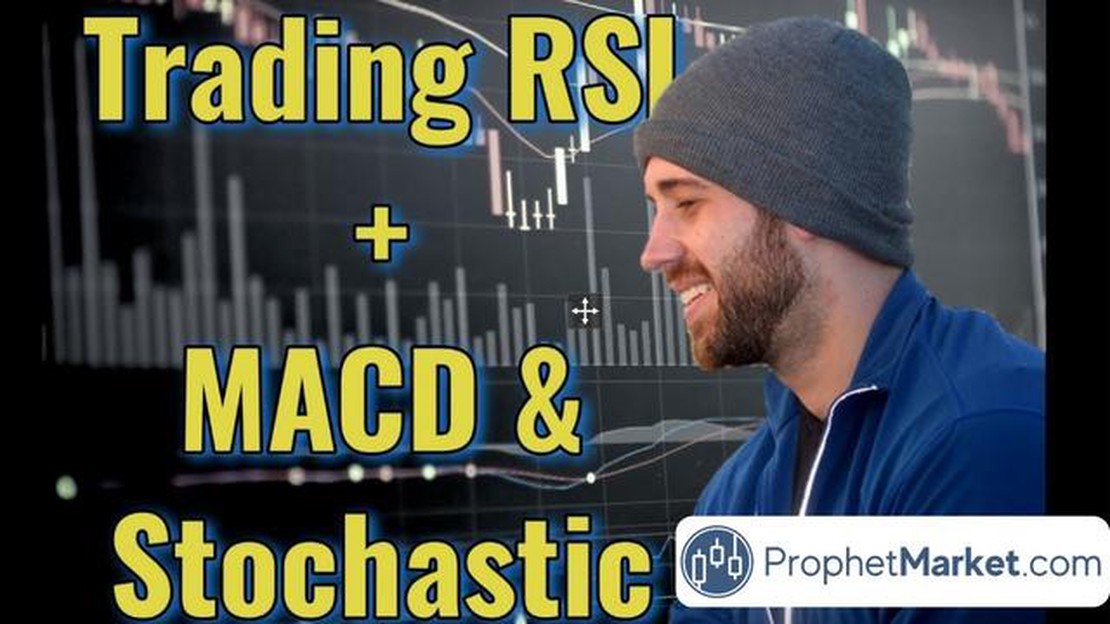
Technical indicators such as Moving Average Convergence Divergence (MACD) and Relative Strength Index (RSI) have long been popular tools among traders and analysts in the financial markets. These indicators are widely used to identify trends, predict price movements, and generate buy or sell signals.
However, as the financial markets continue to evolve, it is becoming increasingly evident that relying solely on MACD and RSI may not be enough to make accurate predictions and achieve consistent profits. This article aims to explore the limits of these traditional technical indicators and shed light on the potential shortcomings they may have.
One of the main limitations of MACD and RSI is their reliance on historical price data. These indicators are calculated based on past price movements, which means they are lagging indicators by nature. As a result, they may fail to capture rapid changes and dynamic market conditions, especially during periods of high volatility or unexpected events.
Furthermore, MACD and RSI only provide information about price and momentum, neglecting other important factors that can affect market behavior. Factors such as fundamental analysis, market sentiment, and macroeconomic trends are crucial in determining the future direction of an asset. By ignoring these factors, MACD and RSI may produce false signals and lead to poor trading decisions.
Disclaimer: The opinions and views expressed in this article are for informational purposes only and should not be considered as investment advice. Trading in financial markets involves risks, and it is important to conduct thorough research and analysis before making any investment decisions.
In conclusion, while MACD and RSI have been valuable tools in technical analysis, it is essential to recognize their limitations and the potential risks associated with relying solely on these indicators. Traders and analysts should consider using a combination of technical and fundamental analysis, as well as incorporating other indicators and market factors, to enhance their trading strategies and increase their chances of success in the dynamic and ever-changing financial markets.
While MACD (Moving Average Convergence Divergence) and RSI (Relative Strength Index) are popular technical indicators used by traders to analyze market trends and make trading decisions, they are by no means the only indicators available. Traders and analysts have developed numerous technical indicators over the years, each with its own unique formula and interpretation.
One such indicator is the Bollinger Bands, created by John Bollinger. Bollinger Bands consist of a middle band, which is usually a simple moving average, and two outer bands that are calculated using the standard deviation of price. Bollinger Bands help traders identify volatility and potential price breakouts.

Another popular indicator is the Stochastic Oscillator, developed by George Lane. The Stochastic Oscillator measures the momentum of price and compares it to the trading range over a set period of time. This indicator helps traders identify overbought and oversold conditions in the market.
The Moving Average is also a widely used indicator. It calculates the average price over a specific period of time and helps traders identify trends. Moving averages can be simple, exponential, or weighted, with each type giving different weightage to recent price data.
Other technical indicators include the Ichimoku Cloud, Fibonacci retracement levels, and the Average True Range. Each indicator has its own strengths and weaknesses and can provide valuable insights into market movements when used in conjunction with other indicators.
It is important for traders to understand that technical indicators should not be used in isolation. The best trading strategies often combine multiple indicators and take into account other factors such as fundamental analysis and market sentiment. By using a variety of indicators, traders can gain a more comprehensive understanding of market trends and make more informed trading decisions.
Read Also: Understanding the Difference: Exercising Stock Options vs Selling
In conclusion, while MACD and RSI are popular and useful technical indicators, there are numerous other indicators available for traders to analyze market trends and make trading decisions. Exploring and incorporating different indicators into trading strategies can help traders gain a broader perspective and improve their chances of success in the market.
While MACD (Moving Average Convergence Divergence) and RSI (Relative Strength Index) are popular technical indicators used by traders and analysts, they have certain limitations that need to be considered. These limitations may impact the reliability and accuracy of the signals generated by these indicators.
Read Also: Projected Price of Merck Stock: What Investors Should Expect3. Lack of context: MACD and RSI only consider price and volume data, ignoring other important factors such as market sentiment, news events, and fundamental analysis. Without considering the broader context, traders may misinterpret the signals generated by MACD and RSI and make poor trading decisions. 4. Oversold and overbought conditions: RSI is often used to identify overbought and oversold conditions in a market. However, these conditions can persist for longer periods than anticipated, leading to false signals and losses. Traders should not solely rely on RSI to identify market tops and bottoms. 5. Subjectivity: MACD and RSI rely on subjective parameters such as period lengths and thresholds. Different traders may use different parameter values, leading to inconsistencies in signal generation and interpretation. This subjectivity can make it difficult to compare and replicate the results obtained by different traders.
| Limitations | Description |
|---|---|
| Lagging nature | React to past price movements |
| False signals | Generated during low volatility or choppy markets |
| Lack of context | Ignore market sentiment, news events, and fundamental analysis |
| Oversold and overbought conditions | May persist for longer periods than expected |
| Subjectivity | Depend on subjective parameters |

It is important for traders to be aware of these limitations and to use MACD and RSI in conjunction with other technical indicators and analysis techniques. By taking a holistic approach to trading, traders can enhance their decision-making process and improve their overall trading performance.
Technical indicators are mathematical calculations based on price and volume data of a financial asset, such as a stock or cryptocurrency. They are used by traders and investors to analyze past price movements and predict future price trends.
MACD stands for Moving Average Convergence Divergence. It is a popular technical indicator used to identify potential buy and sell signals in a financial asset. MACD consists of two lines - the MACD line and the signal line - and a histogram. Traders use the crossover of these lines and the changes in the histogram to make trading decisions.
RSI stands for Relative Strength Index. It is a momentum oscillator that measures the speed and change of price movements. RSI values range from 0 to 100, with readings above 70 indicating overbought conditions and readings below 30 indicating oversold conditions. Traders use RSI to determine whether a financial asset is overbought or oversold and thus likely to reverse its price direction.
While MACD and RSI can be useful indicators, relying on them alone may not be sufficient for accurate trading signals. These indicators are based on historical price data and do not take into account other important factors such as fundamental analysis, market sentiment, and news events that can impact the price of a financial asset. Traders should consider using a combination of different indicators and analysis methods for more accurate predictions.
Technical indicators like MACD and RSI have several limitations. They are lagging indicators, meaning they are based on past price data and may not accurately predict future price movements. They also do not account for fundamental factors that can influence the market. Additionally, these indicators can give false signals during periods of low volatility or in trending markets. Traders should use them in conjunction with other forms of analysis to make well-informed trading decisions.
No, MACD and RSI are not enough to make trading decisions. While they can provide valuable information about trends and momentum, they have limitations and should be used in conjunction with other indicators and factors.

How to recover lost funds from binary options? Binary options trading can be a highly risky endeavor, and many people have found themselves in a …
Read Article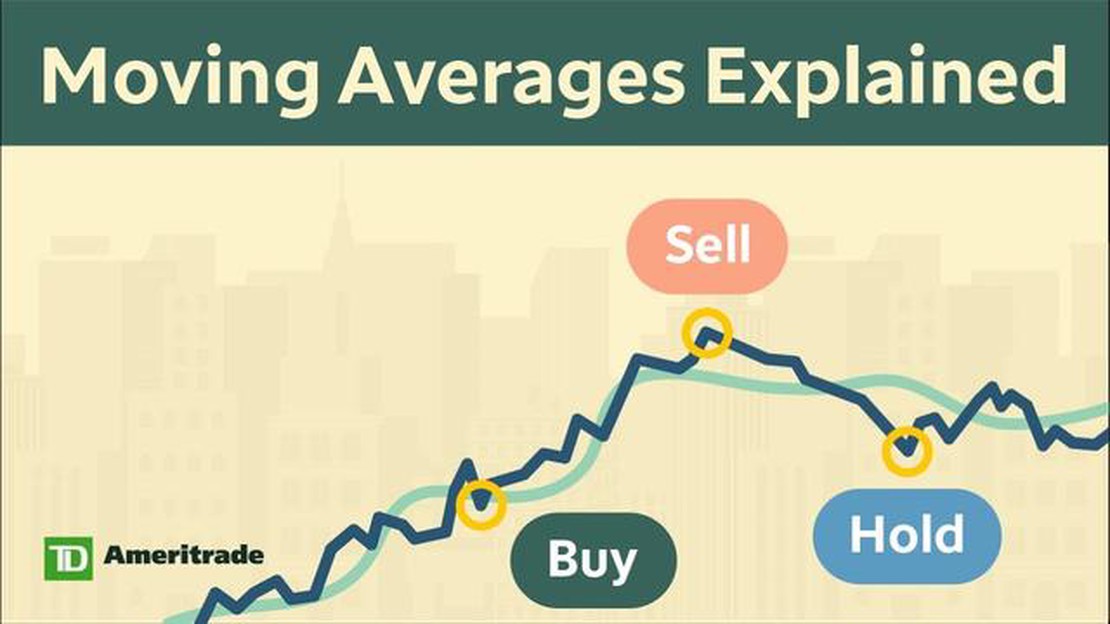
Understanding the Moving Average Method The moving average method is a widely used statistical technique for analyzing and forecasting time series …
Read Article
Best Places to Exchange Money in Sydney When visiting Sydney, one of the first things you need to consider is where to exchange your currency. With so …
Read Article
What is the current S&T policy? The S&P 500 is a stock market index that tracks the performance of 500 of the largest publicly traded companies in the …
Read Article
Where is Xylo from? Xylo is more than just a trendy word - it has a rich history and deep cultural roots that trace back centuries. Originating in …
Read Article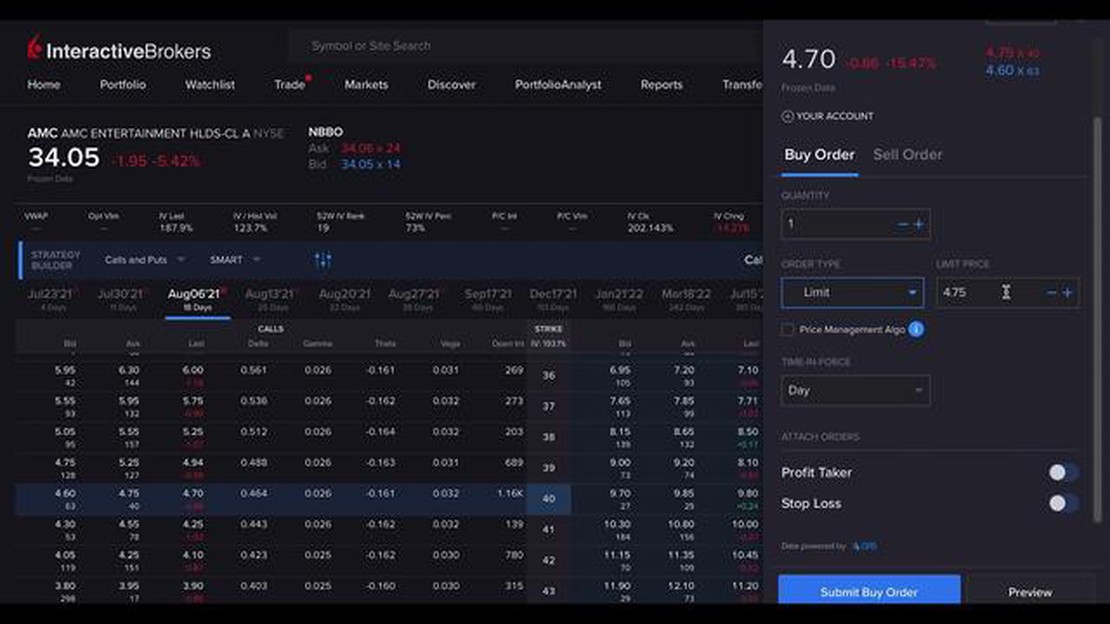
Is IBKR good for options? When it comes to options trading, the choice of broker can make a significant impact on your overall trading experience. One …
Read Article


