


Understanding the Market SQN Score: An Essential Guide
Understanding the Market SQN Score: A Comprehensive Guide In the world of investing, understanding market trends and analyzing investment …
Read Article
The moving average method is a widely used statistical technique for analyzing and forecasting time series data. It is an essential tool for economists, financial analysts, and data scientists who need to understand and make predictions based on historical data.
The moving average method works by smoothing out the fluctuations or noise in a time series data by calculating the average of a specified number of previous data points. This technique helps in identifying trends and patterns in the data, which can provide valuable insights into future behavior.
The moving average method is particularly useful for making short-term forecasts and detecting changes in trends. It is commonly used in various fields, such as finance, economics, sales forecasting, and weather prediction. By using this method, analysts can make informed decisions based on the patterns and trends observed in the data.
In this comprehensive guide, we will delve into the various aspects of the moving average method. We will explore different types of moving averages, such as simple moving average (SMA) and exponential moving average (EMA), and discuss their advantages and disadvantages. Additionally, we will explain how to calculate and interpret moving averages, as well as provide practical examples to help readers understand the concepts better.
Whether you are a beginner or an experienced analyst, this guide will equip you with the knowledge and skills needed to effectively use the moving average method in your analysis and forecasting tasks. So, let’s dive in and uncover the secrets of this powerful statistical technique!
The Moving Average Method is a common analytical technique used in finance and statistics to identify trends and patterns in a dataset. It is widely used in market analysis, forecasting, and time series analysis.
The Moving Average Method calculates the average of a set of data points over a specified time period. It helps to smooth out short-term fluctuations and highlight long-term trends. The method is based on the assumption that historical data can provide insights into future performance.
There are different types of moving averages, including the Simple Moving Average (SMA) and the Exponential Moving Average (EMA). The SMA calculates the average over a fixed period, while the EMA gives more weight to recent data points.

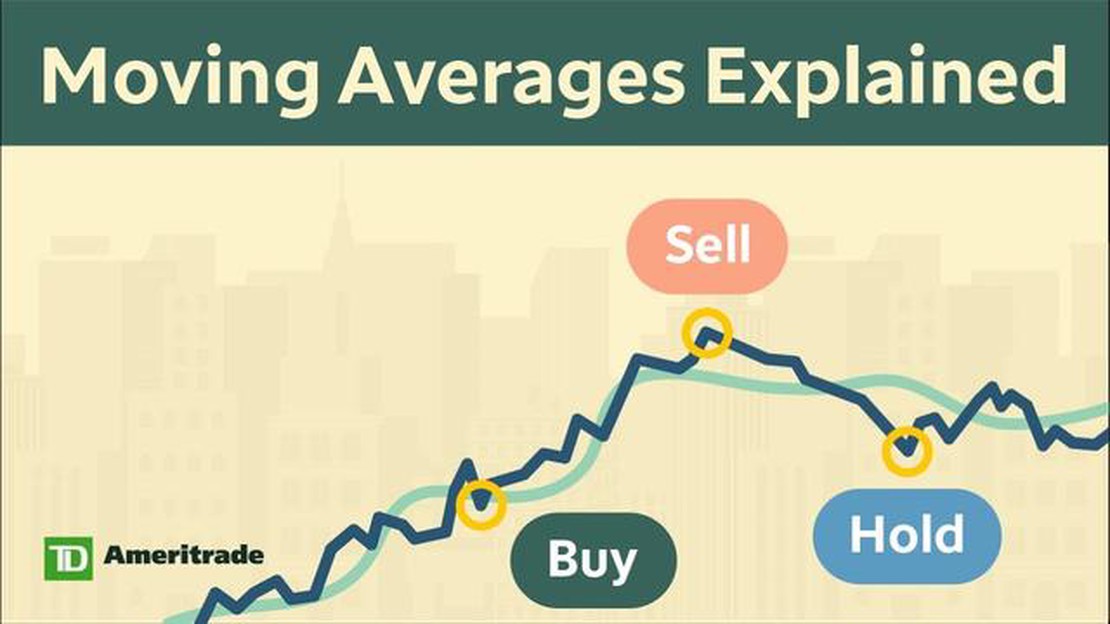
The Moving Average Method is commonly used in financial markets to generate trading signals. A common strategy is to use two moving averages of different time periods. When the shorter-term moving average crosses above the longer-term moving average, it is considered a bullish signal, indicating a potential uptrend. Conversely, when the shorter-term moving average crosses below the longer-term moving average, it is a bearish signal, indicating a potential downtrend.
In addition to identifying trends, the Moving Average Method can also be used to smooth out data and reduce noise. This can be helpful in forecasting, as it can provide a clearer picture of the underlying pattern and direction.
| Advantages | Limitations |
|---|---|
| Easy to calculate and understand | May lag behind significant market changes |
| Reduces the impact of short-term fluctuations | May produce false signals in choppy markets |
| Can be used as a stand-alone tool or in combination with other analysis methods | Works best in trending markets |
In conclusion, the Moving Average Method is a versatile tool that can be used to analyze trends, generate trading signals, and smooth out data. It is widely used in finance and statistics and can provide valuable insights into market behavior.
The moving average method is a commonly used statistical technique that offers several advantages in analyzing data and making predictions:
Read Also: How to Create an Effective Option Strategy: A Step-by-Step Guide
1. Smoothing: The moving average method helps in smoothing out fluctuations in data and reducing the impact of random variations. By taking an average of a specific number of data points, the method creates a trend line that can provide a clearer picture of the underlying pattern.
2. Trend identification: The moving average method is effective in identifying trends in data. By calculating the average over a specific time period, it becomes easier to identify whether the data is moving upwards, downwards, or remaining relatively constant.
Read Also: How to troubleshoot and resolve glitches on Roblox: A comprehensive guide
3. Forecasting: With the moving average method, it is possible to make short-term predictions based on the trend identified. By extrapolating the trend line, analysts can estimate future values and make informed decisions.
4. Easy calculation: The moving average method is relatively simple to calculate, making it accessible to users with basic statistical knowledge. It involves summing up a specified number of data points and dividing the result by the number of points to obtain the average.
5. Flexibility: The moving average method allows for flexibility in the choice of time period for calculation. Users can adjust the time period based on the data being analyzed and the nature of the trend they are interested in.
6. Robustness to outliers: The moving average method is less affected by outliers or extreme values in the data. By averaging multiple points, the impact of individual data points is reduced, making it more robust to anomalies.
Overall, the moving average method provides a reliable and straightforward approach for analyzing and forecasting data. It offers the advantage of smoothing out fluctuations, identifying trends, and making predictions based on historical patterns.

The moving average method is a popular statistical technique used to analyze time series data. It involves taking the average of a set of data points over a specified time period to identify trends and patterns.
The moving average is calculated by adding up a set of data points over a specified time period and then dividing that total by the number of data points in the set.
The moving average is used to identify possible trends and patterns in time series data. It can help smooth out random fluctuations and make it easier to identify long-term trends.
There are several types of moving averages, including the simple moving average (SMA), exponential moving average (EMA), weighted moving average (WMA), and adaptive moving average (AMA). Each type has its own calculation method and is suitable for different types of data.
The moving average method can be used in trading to identify potential buy and sell signals. Traders often use moving averages to track the average price of a security over a specific time period and use it as a reference point for determining entry and exit points.
The Moving Average method is a statistical technique used to analyze time series data by calculating the average value of a set of data points over a specified period of time.
The Moving Average method works by taking a set of data points and calculating the average value for a specified number of periods. This average value is then plotted on a chart to create a moving average line, which helps to identify trends and patterns in the data.

Understanding the Market SQN Score: A Comprehensive Guide In the world of investing, understanding market trends and analyzing investment …
Read Article
Is gnuplot still being used? As one of the oldest graphing tools in the field of data visualization, Gnuplot has been around for decades. But with the …
Read Article
Understanding the Mechanics of Stock Option Dilution When it comes to understanding the inner mechanics of the stock market, one concept that can …
Read Article
Types of Credit Risk: A Comprehensive Guide Credit risk is an essential aspect of the financial industry. Understanding the different types of credit …
Read Article
Comparison of straddle, strangle, and other options strategies A straddle and a strangle are two popular options trading strategies that involve …
Read Article
Is Forex.com Swap Free? Forex trading can be an exciting and potentially profitable venture, but for some religious and cultural reasons, individuals …
Read Article

