
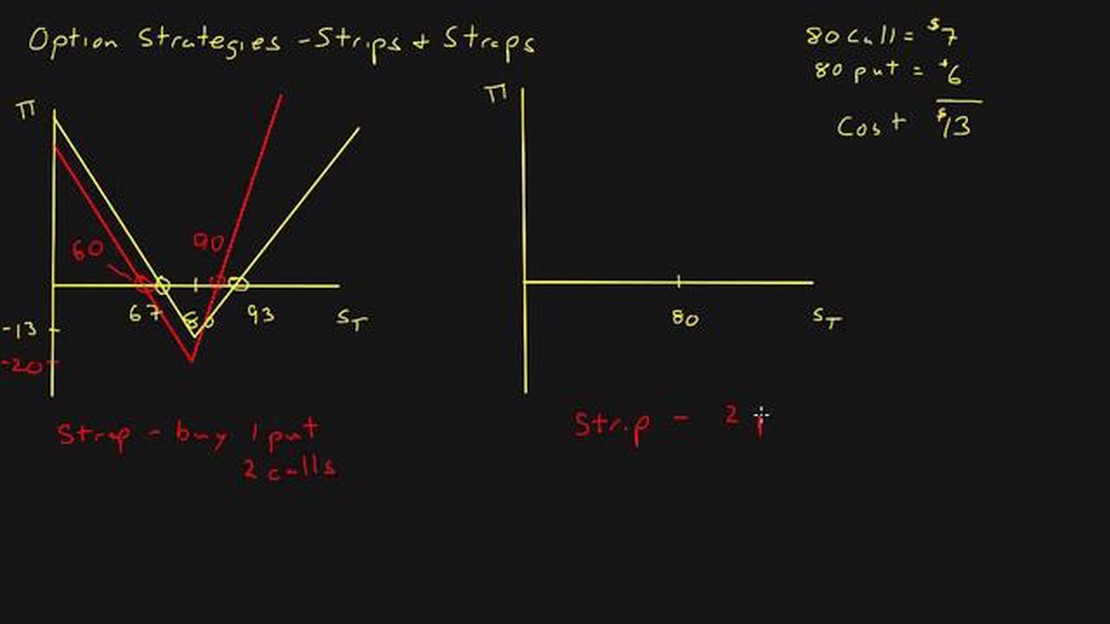

An example of a strip strategy: How to Maximize Profitability with a Strategic Pricing Approach
An Example of a Strip Strategy Introduction In today’s competitive business landscape, companies are constantly seeking ways to maximize …
Read Article
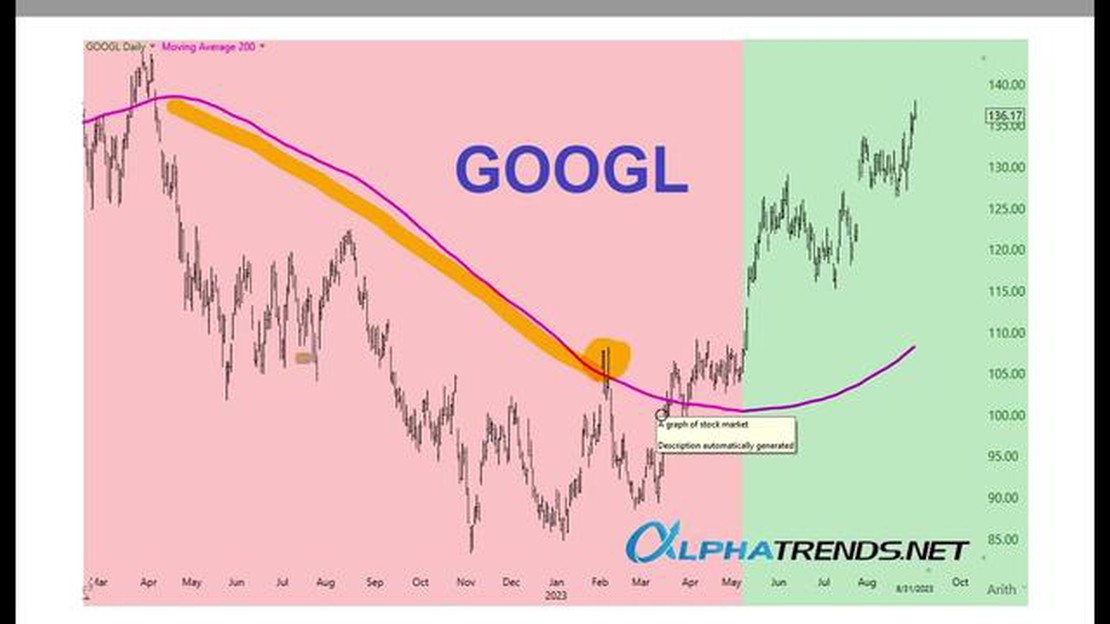
Traders are constantly searching for an edge in the volatile and unpredictable world of the financial markets. One strategy that has gained popularity in recent years is buying on the 200-day moving average. This technical indicator is used by traders to determine the general trend of a stock or market. By studying the past performance of an asset, traders can identify key levels of support and resistance that can help guide their buying decisions.
The 200-day moving average is a simple yet powerful tool that can provide valuable insights into market trends. It is calculated by averaging the closing prices of a stock or market over the past 200 trading days. This long-term moving average is often used as a reference point by traders to gauge the overall health of an asset. When the price of an asset is trading above its 200-day moving average, it is considered to be in an uptrend, indicating potential buying opportunities.
Buying on the 200-day moving average involves waiting for the price of an asset to pull back and retest this key level of support. Traders often use additional technical indicators, such as volume and momentum, to confirm their buying decisions. By combining these tools, traders can increase the probability of success while minimizing their risk.
It is important to note that buying on the 200-day moving average is not a foolproof strategy. Like any trading technique, it has its limitations and risks. Traders should always conduct thorough research and analysis before making any trading decisions. Additionally, it is essential to have a well-defined risk management plan in place to protect against potential losses.
Overall, buying on the 200-day moving average can be a valuable strategy for traders looking to capitalize on market trends. By understanding how this technical indicator works and using it in conjunction with other tools, traders can improve their chances of success. However, it is crucial to remember that no strategy is guaranteed to be profitable, and traders should always practice caution and risk management in their trading activities.
The 200-day moving average is a widely used technical analysis tool that helps traders determine the overall trend of a security. It is calculated by taking the average closing price of a security over the past 200 trading days. The 200-day moving average is often considered a key level of support or resistance and is used by traders to identify potential buying or selling opportunities.
One of the main reasons why the 200-day moving average is so important is its ability to smooth out short-term fluctuations and provide a more accurate representation of the long-term trend. By looking at the 200-day moving average, traders can get a better understanding of whether a security is in an uptrend or a downtrend.

When the price of a security is above its 200-day moving average, it is generally considered to be in an uptrend. This suggests that buyers have been consistently pushing the price higher and that the security may continue to move higher in the future. Traders who use the 200-day moving average as part of their trading strategy may look for buying opportunities when the price pulls back to the 200-day moving average and then bounces off it.
On the other hand, when the price of a security is below its 200-day moving average, it is generally considered to be in a downtrend. This suggests that sellers have been consistently pushing the price lower and that the security may continue to move lower in the future. Traders who use the 200-day moving average as part of their trading strategy may look for selling opportunities when the price rallies up to the 200-day moving average and then reverses.
In addition to identifying trends, the 200-day moving average can also be used to confirm or validate other technical indicators. For example, if a security is in an uptrend and the price pulls back to the 200-day moving average, a trader may look for other technical indicators, such as a bullish candlestick pattern or a positive divergence in the relative strength index (RSI), to confirm the buying opportunity.
Read Also: 1 PKR to 1 INR - Currency Exchange rate
Overall, the 200-day moving average is an important tool for traders as it helps them identify the overall trend of a security and potential buying or selling opportunities. By using this technical analysis tool in combination with other indicators and strategies, traders can improve their chances of making profitable trades in the market.
In order to further strengthen the buy or sell signals generated by the 200-day moving average (MA), traders often use additional indicators. These indicators serve to confirm the market trend and increase the likelihood of making profitable trades.
Here are some common indicators that traders use to confirm the 200-day MA:
1. Volume
Volume is an important indicator to confirm the strength of a market trend. If the price is trending above the 200-day MA and the volume is increasing, it suggests that the trend has strong buying support. On the other hand, if the price is trending below the 200-day MA and the volume is decreasing, it indicates a lack of selling pressure.
2. Relative Strength Index (RSI)
The RSI is a momentum oscillator that measures the speed and change of price movements. It ranges from 0 to 100, with values above 70 indicating overbought conditions and values below 30 indicating oversold conditions. Traders often use the RSI to confirm the signals generated by the 200-day MA. For example, if the price is above the 200-day MA and the RSI is also above 70, it suggests that the market is overbought and a reversal might be imminent.
3. Moving Average Convergence Divergence (MACD)
Read Also: Does AvaTrade Have Demo? A Detailed Guide to AvaTrade's Demo Account
The MACD is a trend-following momentum indicator that shows the relationship between two moving averages of a security’s price. Traders often use the MACD to confirm the signals generated by the 200-day MA. For example, if the MACD line crosses above the signal line while the price is above the 200-day MA, it suggests a bullish signal.
It’s important to note that no single indicator should be relied upon solely. Traders often use a combination of indicators to confirm the signals generated by the 200-day MA before making their trading decisions.
By using indicators to confirm the signals generated by the 200-day MA, traders can increase their confidence in their trades and make more informed decisions. It’s important to regularly monitor these indicators and adjust trading strategies accordingly to stay ahead in the market.

The 200-day moving average is a technical indicator that represents the average closing price of a security over the past 200 trading days.
The 200-day moving average is important for traders because it helps identify the long-term trend of a security. Traders often use it as a reference point to determine the overall direction of the market.
Traders can use the 200-day moving average to buy stocks by waiting for the price of a stock to dip below the 200-day moving average and then rebound above it. This can be a signal that the stock is in an uptrend and may be a good buying opportunity.
Yes, there are risks associated with buying on the 200-day moving average. Sometimes, a stock may temporarily dip below the moving average but then continue to decline further. Traders must be aware of this possibility and use other indicators and risk management strategies to make informed trading decisions.
The 200-day moving average can be used for a wide range of securities, including stocks, indices, commodities, and currencies. However, its effectiveness may vary depending on the specific characteristics of the security being analyzed.

An Example of a Strip Strategy Introduction In today’s competitive business landscape, companies are constantly seeking ways to maximize …
Read Article
Free Forex Books: Best Sources to Download for Free When starting out in the forex market, it is important to have a solid understanding of the basic …
Read Article
EUR USD Projection: Analysis and Predictions The EUR/USD currency pair is one of the most closely watched and volatile currency pairs in the world. As …
Read Article
Minimum Deposit for Mtrading: How Much Do You Need? Mtrading is a popular online brokerage platform that allows traders to invest and trade in various …
Read Article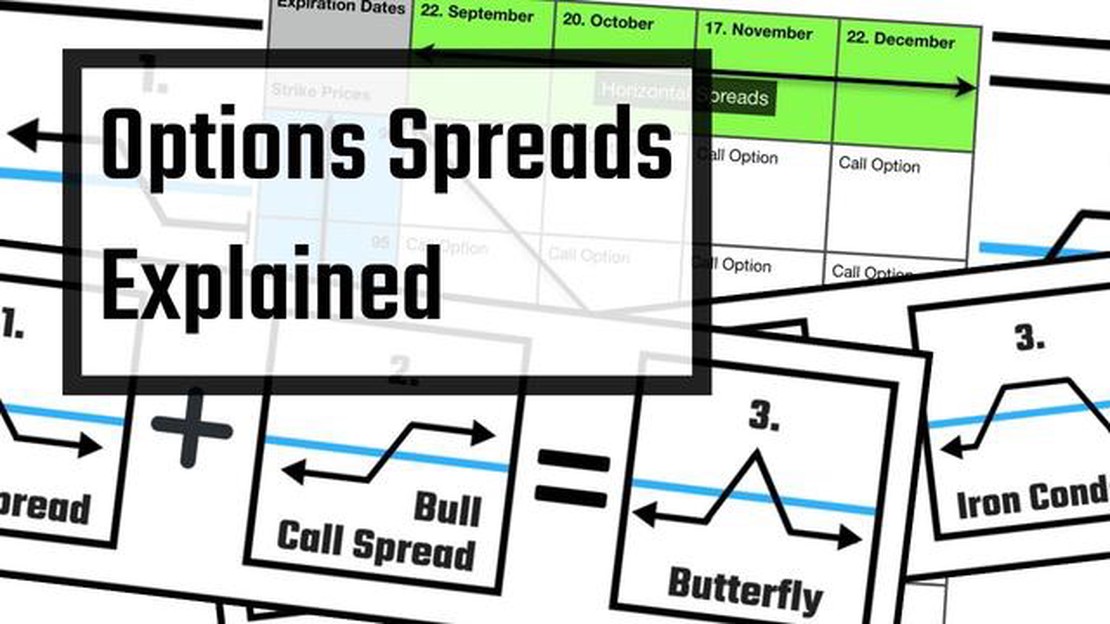
Understanding Different Option Spread Strategies Option trading can be a highly profitable endeavor, but it also involves a significant amount of …
Read Article
Beginner’s Guide to Learning Options Strategy Options trading can be an exciting and potentially lucrative investment strategy, but it can also be …
Read Article


