


What happens if your forex account goes negative? | Expert insights and solutions
What Happens if Forex Account Goes Negative? Forex trading can be an exhilarating and potentially profitable venture, but it also comes with certain …
Read Article
When it comes to analyzing financial data, moving average analysis is a powerful tool that can provide valuable insights. Moving averages are widely used in various fields, including stock market analysis, forex trading, and technical analysis. By calculating the average price over a specific time period, moving averages help traders and investors identify trends, spot potential reversals, and make informed decisions.
One of the main applications of moving average analysis is in identifying and confirming trends. By smoothing out price fluctuations, moving averages can help traders identify the overall direction of a market or stock. For example, a rising moving average indicates an uptrend, while a falling moving average suggests a downtrend. This information can be extremely valuable for both short-term traders looking for quick profits and long-term investors trying to maximize their returns.
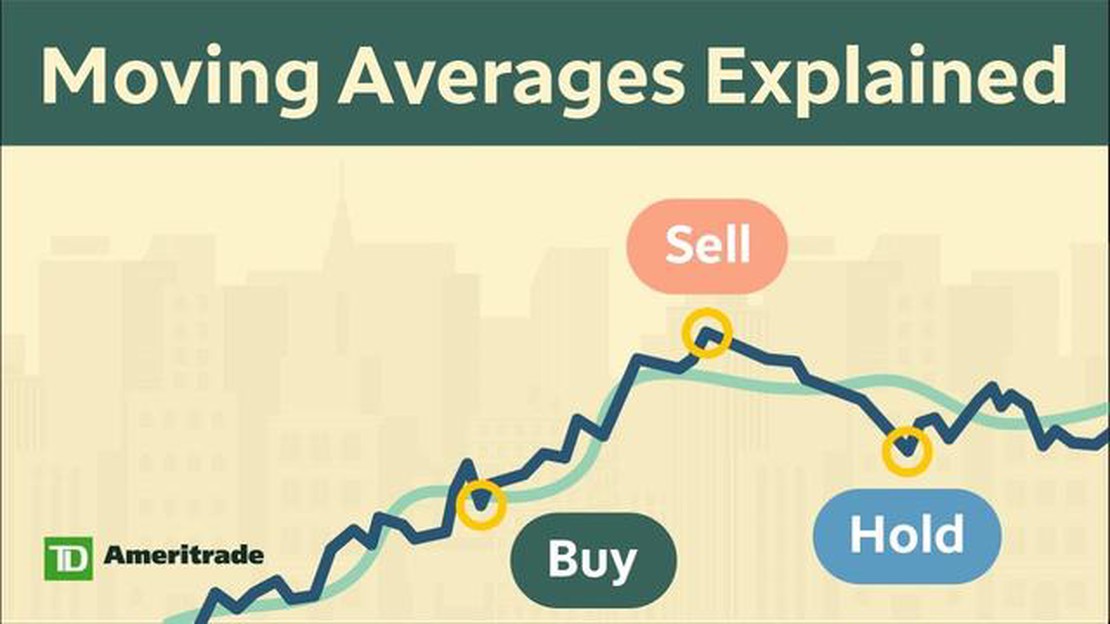
In addition to trend identification, moving averages can also help traders spot potential reversals. When the price crosses above or below a moving average, it can indicate a change in market sentiment. Traders often use this as a signal to enter or exit a trade. For example, if the price crosses above a moving average, it may indicate the start of an uptrend and provide a buying opportunity. Conversely, if the price crosses below a moving average, it may signal a downtrend and prompt traders to sell.
Furthermore, moving average analysis offers several benefits. Firstly, it helps smooth out price data and filter out market noise, which can improve the accuracy of technical analysis. Secondly, it provides a visual representation of price trends, making it easier for traders to understand and interpret market movements. Lastly, moving averages can be customized and adjusted to suit different trading strategies and timeframes, allowing traders to adapt to changing market conditions.
In conclusion, moving average analysis is a versatile and powerful tool that is widely used in the financial industry. By providing insights into price trends and potential reversals, it helps traders and investors make informed decisions. Whether you are a short-term trader or a long-term investor, incorporating moving averages into your analysis can greatly improve your chances of success.
Moving Average Analysis is a popular technical analysis tool used by traders and investors to identify trends and make informed trading decisions. It involves calculating the average price of an asset over a specific period of time to smooth out short-term fluctuations and reveal underlying trends.

The Moving Average (MA) is calculated by adding up the closing prices of the asset for a certain number of periods and dividing it by the number of periods. This creates a line on the price chart that represents the average price over time.
There are different types of moving averages, including the Simple Moving Average (SMA) and the Exponential Moving Average (EMA). The SMA gives equal weightage to each data point, while the EMA gives more weightage to recent data, making it more responsive to recent price movements.
Moving Average Analysis is used to identify the direction of the trend. When the price is above the moving average, it is considered a bullish signal, indicating an uptrend. Conversely, when the price is below the moving average, it is considered a bearish signal, indicating a downtrend.
Read Also: Today's Dollar Rate at BDO: The Latest Exchange Rate for USD
In addition to trend identification, moving averages can also be used to generate trading signals. Traders often look for crossovers between different moving averages to determine when to enter or exit a position. For example, when a short-term moving average crosses above a long-term moving average, it is considered a buy signal, while a crossover in the opposite direction is considered a sell signal.
Benefits of Moving Average Analysis include its simplicity and effectiveness in identifying trends and generating trading signals. It helps traders avoid making impulsive decisions based on short-term price fluctuations and instead focus on the overall trend of the market.
| Advantages | Disadvantages |
|---|---|
| Easy to understand and interpret | May lag behind the current market price |
| Can be used with any timeframe or asset | May generate false signals in choppy or sideways markets |
| Helps filter out noise and identify significant price moves | Not a standalone indicator and should be used in conjunction with other analysis tools |
In conclusion, Moving Average Analysis is a powerful tool that can help traders and investors identify trends, generate trading signals, and make informed decisions. By understanding how moving averages work and using them in conjunction with other analysis tools, traders can enhance their trading strategies and increase their chances of success in the market.
When using moving average analysis to make informed decisions, it is important to keep a few tips in mind:
| 1. Choose the right moving average period: | Experiment with different time periods to find the one that best aligns with your trading strategy. Smaller periods can provide more timely signals, while larger periods can help smooth out volatility. |
| 2. Understand the market trend: | Identify the current market trend before making any decisions. Moving averages can help confirm or reject a trend, allowing you to adjust your strategy accordingly. |
| 3. Combine with other indicators: | Consider using moving averages in conjunction with other technical indicators to strengthen your analysis. This can help reduce false signals and provide a more comprehensive view of the market. |
| 4. Use multiple timeframes: | Look at moving averages across different timeframes to gain a better understanding of the overall market sentiment. This can help you make more accurate predictions and avoid knee-jerk reactions. |
| 5. Be aware of potential lag: | Remember that moving averages are lagging indicators, so they may not always provide real-time signals. Be patient and consider other factors before making a decision. |
| 6. Monitor for crossovers: | Keep an eye out for moving average crossovers, as they can indicate potential trend reversals. For example, a short-term moving average crossing above a long-term moving average may signal a bullish trend. |
| 7. Practice risk management: | Always consider your risk tolerance and implement appropriate risk management strategies. Moving averages can help identify entry and exit points, but they are not foolproof. Use them as a tool, not a guarantee. |
Read Also: What is a Trading Turret? | All You Need to Know about Trading Turrets
By following these tips and adapting them to your trading style, moving average analysis can be a valuable tool in your technical analysis toolbox.
Moving average analysis is a statistical method used to analyze data by calculating the average value over a specific time period, updating it as new data becomes available.
Moving average analysis works by taking a set of data points and calculating the average value over a certain time period. This average is then updated as new data points are added.

The purpose of moving average analysis is to identify trends and patterns in data. It is commonly used in finance and stock market analysis to smooth out price fluctuations and make predictions about future price movements.
Using moving average analysis can help traders and investors to make informed decisions based on historical data. It can provide insights into trends, help identify support and resistance levels, and enable the prediction of potential price movements.
Moving average analysis can be applied in various fields. In finance, it is used to analyze stock prices and make predictions. In epidemiology, it is used to track the spread of diseases. In weather forecasting, it is used to predict future temperatures.
Moving average analysis is a statistical technique used to analyze data over a series of time periods by calculating a series of averages. It helps to identify trends and patterns in the data by smoothing out short-term fluctuations.

What Happens if Forex Account Goes Negative? Forex trading can be an exhilarating and potentially profitable venture, but it also comes with certain …
Read Article
Treatment of M1 Garand Stocks: An Overview The M1 Garand rifle, used extensively by the United States during World War II, is renowned for its …
Read Article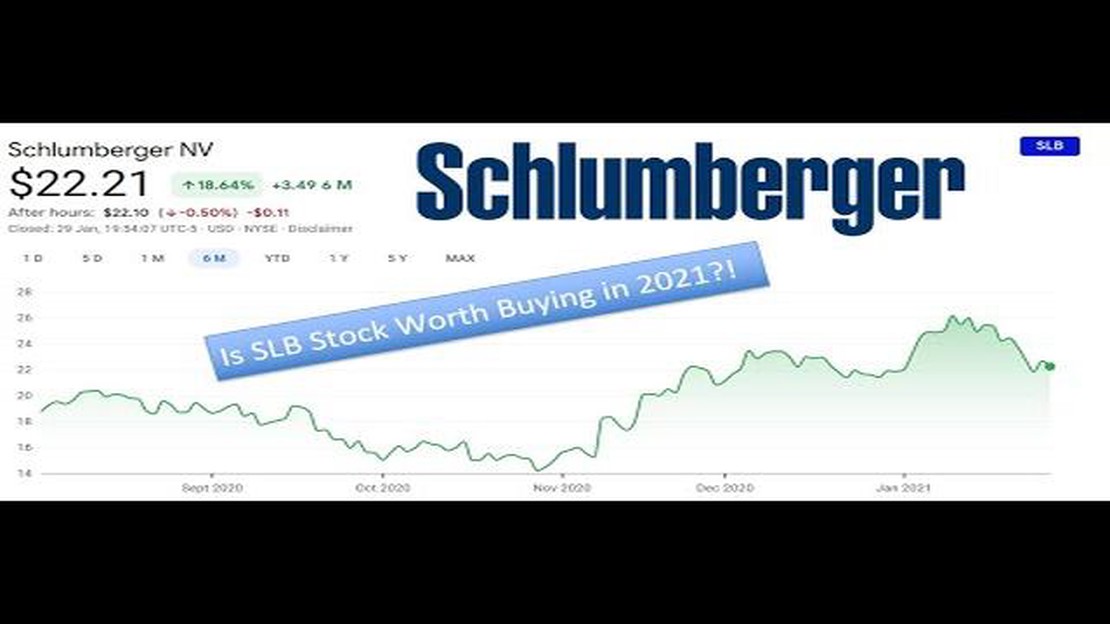
What is the target for SLB stock? The stock market is constantly changing, and investors are always looking for insights and predictions to make …
Read Article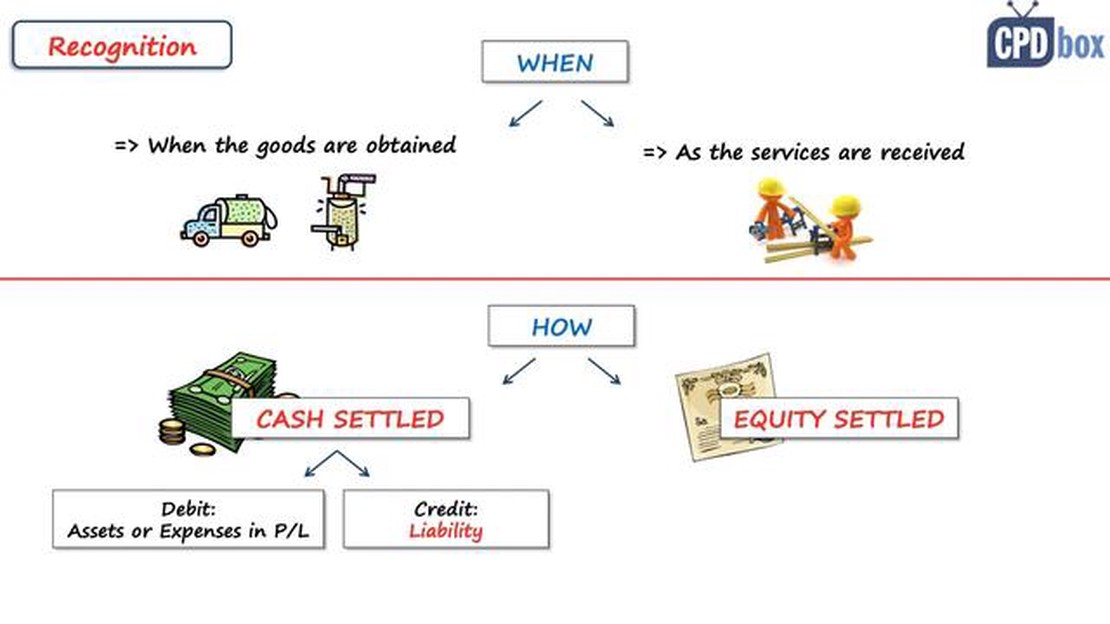
IFRS 2: Share-based Payment IFRS 2, which stands for International Financial Reporting Standard 2, provides guidance on the accounting treatment for …
Read Article
How do you pronounce Benedictine? When it comes to pronouncing the word “Benedictine,” you may encounter some confusion. This guide aims to provide …
Read Article
Should You Invest in a Trading Course? Exploring the Value and Benefits Trading in financial markets can be a potentially lucrative endeavor, but it …
Read Article


