


10 Tips for Journaling Your Forex Trading Journey
Effective Strategies for Journaling Forex Trading Journaling is a powerful tool for tracking your progress and improving your skills in any endeavor, …
Read Article
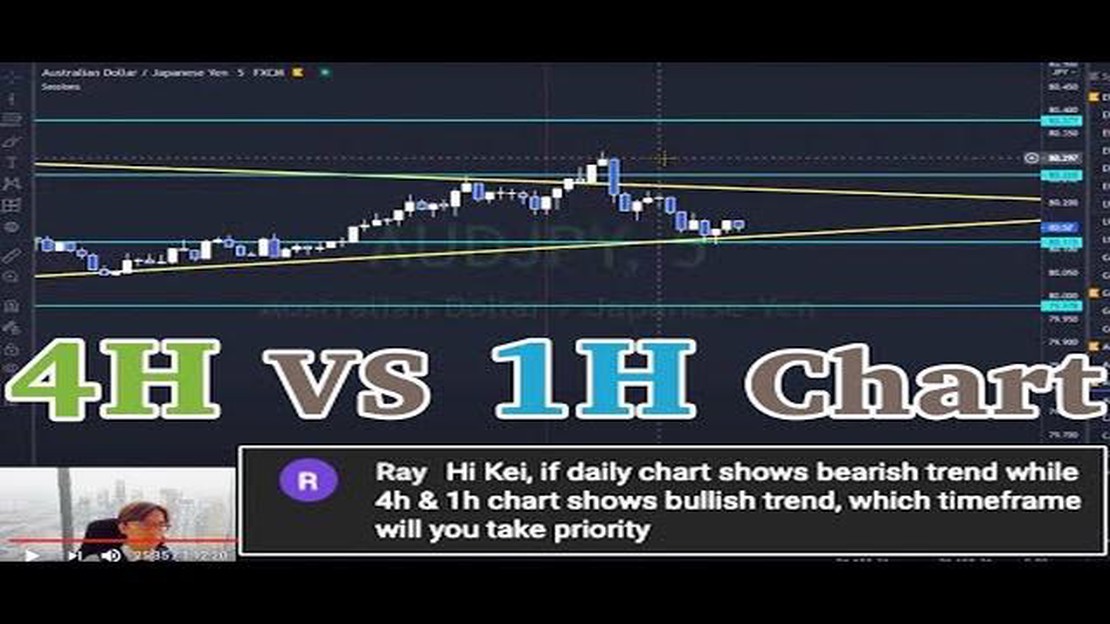
The H4 time frame, also known as the 4-hour chart, is a popular timeframe used by traders in the financial markets. It represents a period of 4 hours, with each candlestick or bar on the chart depicting the price movement during that time frame. Understanding the H4 chart can be essential for traders as it provides valuable insights into market trends and price action.
The H4 time frame allows traders to analyze the market in more detail compared to higher time frames like daily or weekly charts, while still providing a broader perspective compared to lower time frames like 1-hour or 15-minute charts. This intermediate timeframe is often favored by swing traders and longer-term investors who seek to capture larger market moves and trends.
When analyzing the H4 chart, traders often look for patterns, support and resistance levels, and key technical indicators to identify potential entry and exit points. The longer time frame allows for a clearer view of market trends and helps filter out some of the noise and volatility associated with shorter time frames.
In addition to technical analysis, traders may also consider fundamental factors and economic data releases that may impact the market within the 4-hour time frame. This combination of technical and fundamental analysis can provide a comprehensive understanding of the market and assist traders in making informed trading decisions.
Overall, the H4 time frame is a valuable tool for traders, offering a balance between detailed analysis and a broader perspective. By understanding how to interpret and utilize the H4 chart effectively, traders can enhance their trading strategies and potentially improve their profitability in the financial markets.
The H4 time frame is a popular time frame used in trading and technical analysis. It stands for “four hours” and represents a period of time in which each candlestick on the chart represents four hours of trading activity.
Traders often use the H4 time frame to analyze medium-term price movements and identify potential trading opportunities over a period of several days to a few weeks. It is especially useful for traders who cannot monitor the market constantly but still want to take advantage of longer-term trends.
On an H4 chart, each candlestick represents four hours of trading activity, with the opening price represented by the start of the candlestick and the closing price represented by the end of the candlestick. The high and low of the time period are represented by the upper and lower wicks of the candlestick.

The H4 time frame allows traders to zoom in on shorter-term price movements while still capturing enough data to identify meaningful trends and patterns. It provides a balance between the shorter time frames, which can be overly volatile, and the longer time frames, which can be too slow for many traders.
Traders often use technical indicators and chart patterns on the H4 time frame to guide their trading decisions. They may look for support and resistance levels, trendlines, moving averages, and other patterns to identify potential entry and exit points.
It’s important to note that trading decisions should not be made based on the H4 time frame alone. Traders should also consider other factors such as fundamental analysis, risk management, and market sentiment before making any trading decisions.
In conclusion, the H4 time frame is a valuable tool for traders looking to analyze medium-term price movements and identify potential trading opportunities. By using this time frame, traders can capture enough data to make informed trading decisions while still focusing on shorter-term price movements.
The H4 chart, also known as the 4-hour chart, is a popular time frame used by traders in the Forex market. It represents four hours of price data, with each candlestick on the chart representing the price movement over a four-hour period. Understanding the H4 chart is crucial for traders as it provides valuable information about price trends and helps in making informed trading decisions.
Read Also: Exploring the World's Strongest Reserve Currencies: Which Currency Reigns Supreme?
One of the main advantages of the H4 chart is that it provides a balance between short-term and long-term trading. It is considered a medium-term time frame, allowing traders to capture significant price movements without being overwhelmed by noise and fluctuations that may occur in shorter time frames.
When analyzing the H4 chart, traders often look for key support and resistance levels, trend lines, and chart patterns. These technical indicators help identify potential entry and exit points, as well as determine the strength of a trend. The H4 chart can also be used to identify market trends by analyzing the relationship between the highs and lows of each candlestick.
Read Also: Exploring the Debt of KGC: Everything You Need to Know
Traders use a variety of tools and indicators to analyze the H4 chart effectively. Moving averages, oscillators, and Fibonacci retracements are commonly used to identify trends, momentum, and potential reversal points. These indicators can help traders confirm their analysis and make more accurate predictions.
It is important for traders to keep in mind that the H4 chart is just one of many time frames available, and it should be used in conjunction with other time frames for a comprehensive analysis. Understanding the H4 chart can greatly enhance a trader’s ability to identify trends, predict future price movements, and make profitable trading decisions in the Forex market.
In conclusion, the H4 chart is a valuable tool for traders in the Forex market. It provides a medium-term perspective of price movements and helps identify trends and potential trading opportunities. By understanding the H4 chart and using it in conjunction with other time frames, traders can improve their analysis and increase their chances of success in the market.
Using the H4 chart can provide traders with several important benefits:
Overall, the H4 chart provides traders with a balanced view of the market, offering a good balance between the short-term and long-term perspectives. It can be a valuable tool for traders looking to make medium-term trading decisions and for those who want to avoid getting caught up in the noise of shorter timeframes.

The H4 time frame is a type of chart used in technical analysis to analyze price movements in the financial markets. It represents a four-hour time period, with each candlestick or bar on the chart representing four hours of trading activity.
To interpret the H4 chart, you can look for patterns, trends, and support/resistance levels. You can also use technical indicators to help identify potential entry and exit points. It’s important to consider other time frames and market conditions when analyzing the H4 chart.
The H4 time frame provides a balance between shorter-term and longer-term perspectives. It can help traders identify medium-term trends and make more informed trading decisions. Additionally, the four-hour time frame can provide clearer and more reliable signals compared to shorter time frames.
The H4 chart is not typically used for scalping, as it represents a longer time period. Scalping strategies usually involve trading on much shorter time frames, such as the one-minute or five-minute charts. However, the H4 chart can still be useful for identifying potential longer-term trends and support/resistance levels.
The H4 chart differs from other time frames, such as the H1 (one-hour) or daily charts, in terms of the time period it represents. The H4 chart provides a middle ground between shorter time frames and longer time frames. As a result, it can help traders identify medium-term trends and potential trading opportunities.
The H4 time frame refers to a specific time interval in technical analysis, where each candle on the chart represents a four-hour period of trading activity.

Effective Strategies for Journaling Forex Trading Journaling is a powerful tool for tracking your progress and improving your skills in any endeavor, …
Read Article
What is the TSX index name? The TSX Index is one of the premier stock market indexes in Canada. It represents the performance of the top companies …
Read Article
Projected Price of Merck Stock Merck & Co., Inc. is a leading multinational pharmaceutical company that has been on the radar of many investors in …
Read Article
Understanding Cyclone Software: Everything You Need to Know Cyclone Software is a cutting-edge technology that aims to revolutionize the way …
Read Article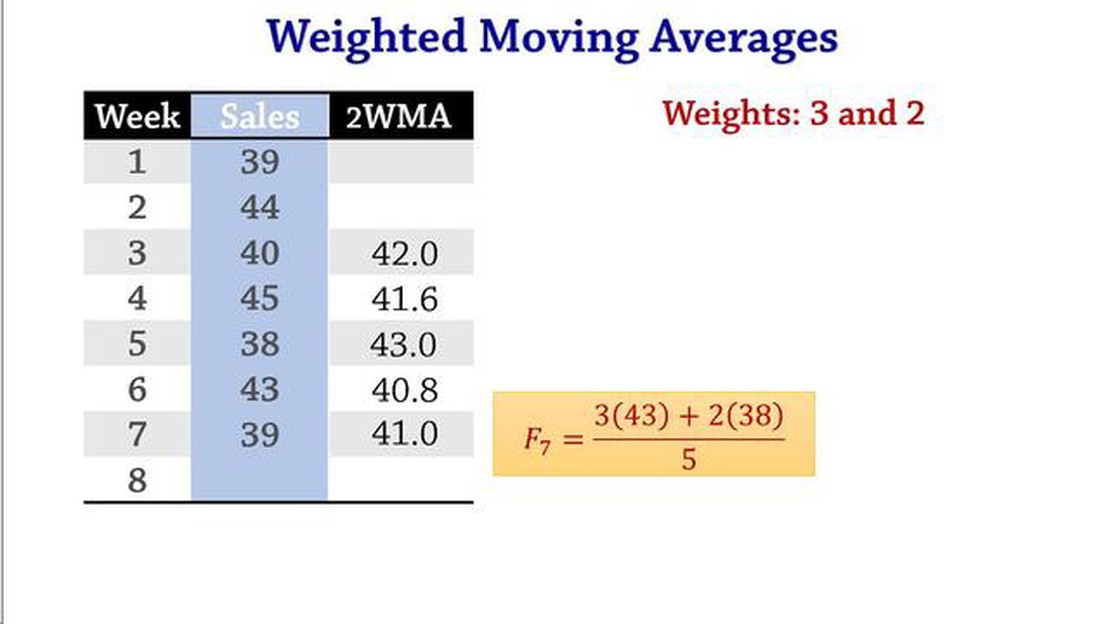
Understanding The L Weighted Moving Average Technical analysis is an essential tool for traders and investors in the financial markets. It helps them …
Read Article
Understanding Futures Volume and How to Analyze It Futures volume is a critical aspect of trading that every investor should understand and analyze. …
Read Article


