


Understanding Futures in Forex Trading: A Comprehensive Guide
Understanding Futures in Forex Trading Forex trading is a complex and ever-evolving market that offers countless opportunities for investors. Within …
Read Article
In time series analysis, a moving average (MA) model is a commonly used method to forecast future values based on past observations. It helps to identify underlying trends and patterns in the data. A key component of the MA model is the residual, which plays a crucial role in determining the accuracy of the model.
The residual, also known as the error term, is the difference between the observed value and the predicted value from an MA model. It represents the part of the data that cannot be explained by the model. In other words, it captures the random variation or noise in the data that is not accounted for by the model.
For example, let’s say we have a sales dataset and we want to use an MA model to forecast future sales. The model estimates the expected sales based on the past observations. The residual is then calculated by subtracting the predicted sales from the actual sales. It tells us how well the model is able to capture the true sales pattern.
The residuals in an MA model are typically assumed to be normally distributed with mean zero and constant variance. This assumption is essential for the model to make accurate predictions. If the residuals do not follow a normal distribution or exhibit a pattern, it indicates that the model may not be capturing all the relevant information in the data.
An important task in MA modeling is to analyze the residuals and check for any patterns or outliers. This can be done using statistical tests or visual examination of residual plots. By understanding the properties of the residuals, we can assess the adequacy of the MA model and make necessary adjustments to improve its performance.
In the context of moving average (MA) models, a residual refers to the difference between the observed values and the predicted values at each point in the time series. It represents the unexplained portion of the data that cannot be accounted for by the model.
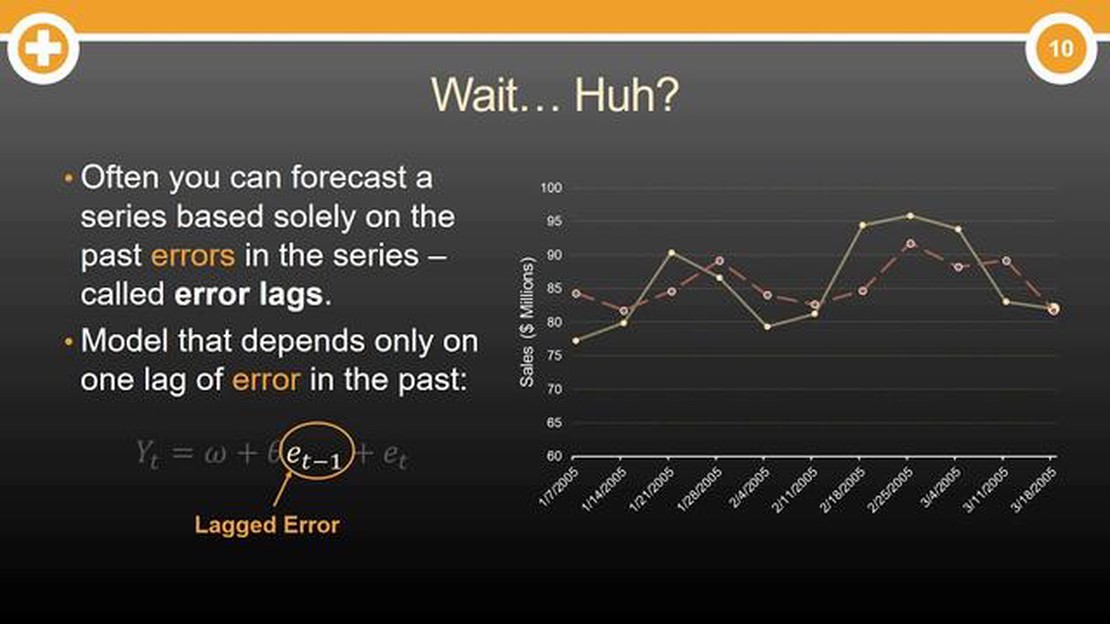
The MA model is a type of time series model that represents the observed values as a function of the past error terms and current random shocks. These error terms are also known as residuals. In an MA model, the residuals are assumed to be white noise, which means that they are uncorrelated and have constant variance.

When fitting an MA model to a time series, the parameters of the model are estimated using a statistical technique called maximum likelihood estimation. Once the model is fitted, the residuals are calculated by subtracting the predicted values from the observed values. The residuals can be used to assess the goodness of fit of the model, test for the presence of autocorrelation, and identify outliers or unusual patterns in the data.
By examining the residuals, analysts can determine whether the model adequately captures the underlying patterns and dynamics of the time series. If the residuals exhibit autocorrelation or have non-constant variance, it suggests that the model is misspecified and needs to be revised. Conversely, if the residuals show no evidence of autocorrelation and have constant variance, it indicates that the model is a good approximation of the data.
Read Also: Discover the Average Exchange Rate in Singapore | Expert Guide
Suppose we have a time series of monthly sales data for a particular product. We want to model the sales using an MA(1) model, which means that the observed values are a function of the current error term and the error term from the previous month. After estimating the parameters of the model, we calculate the residuals by subtracting the predicted sales from the observed sales for each month. By analyzing the residuals, we can determine if the MA(1) model adequately explains the variation in the sales data.
| Month | Observed Sales | Predicted Sales | Residual |
|---|---|---|---|
| January | 100 | 90 | 10 |
| February | 95 | 105 | -10 |
| March | 110 | 100 | 10 |
| April | 105 | 110 | -5 |
| May | 120 | 115 | 5 |
In this example, the residuals indicate the deviations between the observed sales and the predicted sales based on the MA(1) model. The positive and negative residuals suggest that the model slightly underestimates the sales in January and April, respectively. By examining the patterns in the residuals, we can make further adjustments to the model to improve its accuracy in predicting future sales.
In a moving average (MA) model, residuals play a crucial role in understanding the model’s performance and validity. Residuals represent the difference between the observed value and the predicted value from the MA model.
When fitting an MA model to a dataset, the model makes predictions based on a linear combination of past observed values and current error terms. The residuals are calculated as the difference between the observed values and the predicted values. They provide an indication of how well the MA model fits the data.
The residuals in an MA model should ideally have the following properties:
Read Also: The MUI's Fatwa: Understanding the Regulation of Buying and Selling Al Sharf Currency
To assess the properties of the residuals, various diagnostic tests and visualizations can be used. Some commonly used diagnostic techniques include:
By analyzing the residuals and using these diagnostic tools, it is possible to identify any issues with the MA model and make necessary adjustments. Understanding and monitoring the concept of residuals is essential to ensure accurate and reliable predictions from the MA model.

Residuals in a moving average (MA) model represent the difference between the observed values and the predicted values. They are the unexplained part of the data that cannot be accounted for by the model.
Residuals in a moving average (MA) model are calculated by subtracting the predicted values from the observed values. The difference between the observed and predicted values gives us the residual for each data point.
Positive residuals in a moving average (MA) model indicate that the observed values are higher than the predicted values. This suggests that the model has underestimated the values or there may be some other factors influencing the data that are not captured by the model.
In theory, residuals in a moving average (MA) model should follow a normal distribution. However, in practice, this may not always be the case. Residuals can deviate from normality due to various reasons such as outliers, misspecification of the model, or violation of assumptions.
Analyzing residuals in a moving average (MA) model can provide insights into the adequacy of the model. By examining the patterns and properties of residuals, we can assess whether the model captures all the important information in the data or if there are underlying trends, seasonality, or other factors that need to be included in the model.
A moving average (MA) model is a statistical model commonly used in time series analysis to forecast future values of a variable based on its past values. It is a type of linear model that incorporates a moving average of the past error terms.

Understanding Futures in Forex Trading Forex trading is a complex and ever-evolving market that offers countless opportunities for investors. Within …
Read Article
Is JPY stronger than AUD? The exchange rate between the Japanese Yen (JPY) and the Australian Dollar (AUD) is a topic of interest for global investors …
Read Article
Is UniCredit a commercial bank? UniCredit is a leading European commercial bank with a strong presence in Italy and other key markets. With its …
Read Article
Understanding Stock Put Options: What You Need to Know A stock put option is a financial contract that gives the holder the right, but not the …
Read Article
Understanding RSS Import: A Complete Guide RSS (Really Simple Syndication) is a standardized format used to publish frequently updated content on the …
Read Article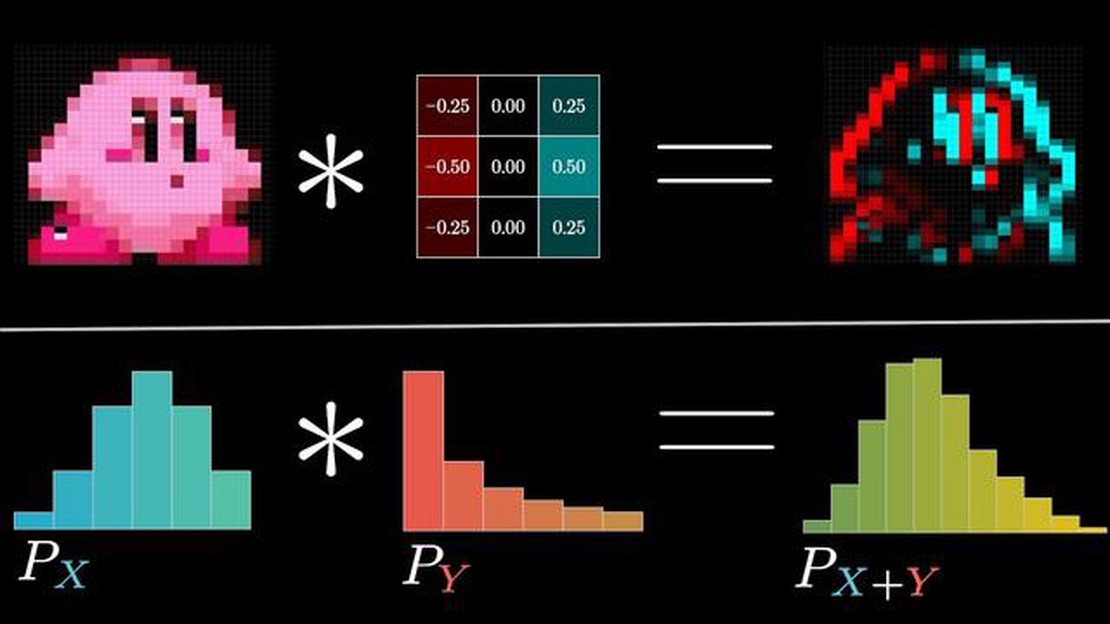
Is a moving average a convolution? A moving average and a convolution are two common techniques used in signal processing and time series analysis. …
Read Article

