


Cost of Moving from LA to Hawaii: Factors to Consider
Cost of Moving from LA to Hawaii Planning a move from Los Angeles to Hawaii can be an exciting adventure, but it’s important to consider the cost of …
Read Article
Bollinger Bands are a popular technical analysis tool used by day traders to identify potential price breakouts and reversals. Developed by John Bollinger in the 1980s, Bollinger Bands are based on the concept of volatility and consist of a simple moving average with an upper and lower band.
The upper band is calculated by adding a certain number of standard deviations to the moving average, while the lower band is calculated by subtracting the same number of standard deviations. This creates a channel around the price that contracts and expands based on market volatility.
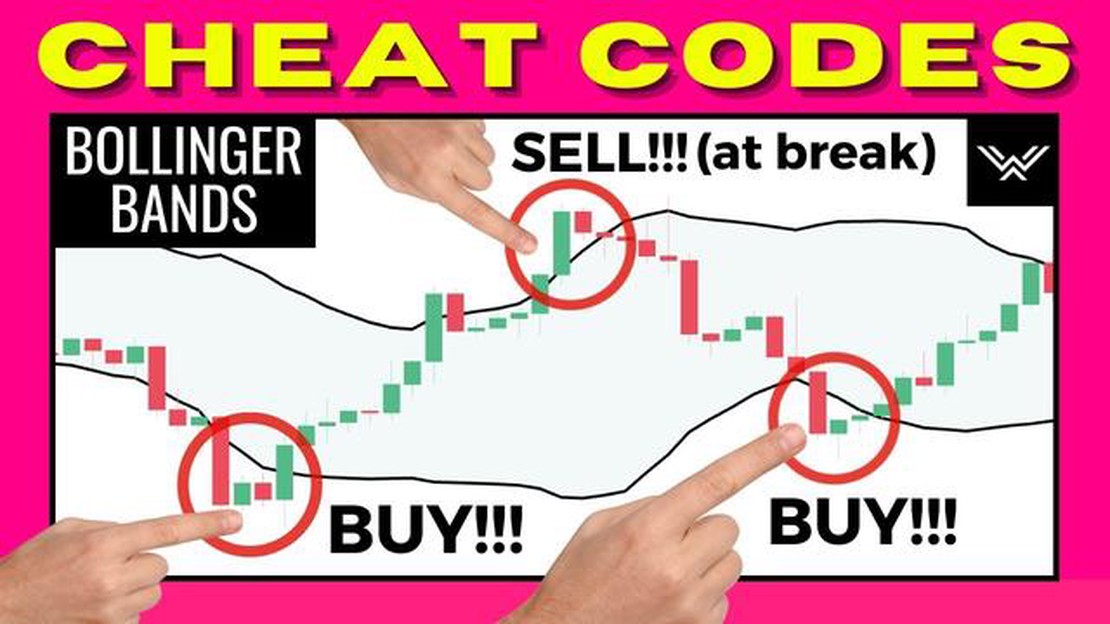
Traders use Bollinger Bands to identify overbought and oversold conditions in the market. When the price reaches the upper band, it may be a sign of overbought conditions and a potential reversal in the price. Conversely, when the price reaches the lower band, it may indicate oversold conditions and a potential price reversal to the upside.
In addition to identifying overbought and oversold conditions, traders also use Bollinger Bands to spot potential breakouts. When the price breaks above the upper band, it may signal a bullish breakout, while a price break below the lower band may suggest a bearish breakout. Traders can use this information to enter or exit trades and adjust their trading strategies accordingly.
Overall, Bollinger Bands are a versatile tool that can be used in various day trading strategies. By combining Bollinger Bands with other technical indicators and chart patterns, traders can develop effective strategies to capitalize on price movements in the market.
Bollinger Bands are a popular technical analysis tool used by day traders to understand market volatility and identify potential trade opportunities. They consist of a middle band, which is a simple moving average (SMA), and an upper and lower band, which are calculated by adding and subtracting a standard deviation to the middle band, respectively.
One of the main advantages of using Bollinger Bands in day trading is their ability to provide valuable information about price levels that may be overbought or oversold. When the price reaches the upper band, it may be an indication that the market is overbought and due for a reversal or pullback. Conversely, when the price reaches the lower band, it may indicate that the market is oversold and could potentially bounce back.
In addition to identifying overbought and oversold levels, Bollinger Bands can also help traders identify potential breakouts. Breakouts occur when the price breaks through the upper or lower band, indicating a significant shift in market momentum. Traders can use this information to enter trades in the direction of the breakout, potentially resulting in profitable opportunities.
Another benefit of using Bollinger Bands is their ability to provide visual representation of volatility. When the bands widen, it indicates an increase in volatility, while a contraction in the bands suggests a decrease in volatility. Traders can use this information to gauge market conditions and adjust their trading strategies accordingly.
Furthermore, Bollinger Bands can be combined with other technical indicators and analysis techniques to enhance trading decisions. For example, some traders may use Bollinger Band squeezes, which occur when the bands contract tightly, as a signal for an imminent breakout. Others may use Bollinger Band width in combination with other indicators to identify potential trend reversals.
In conclusion, Bollinger Bands play a crucial role in day trading strategies as they provide valuable insights into market volatility, overbought and oversold levels, breakouts, and trend reversals. By using Bollinger Bands effectively, day traders can enhance their trading decisions and potentially increase their profitability.

Bollinger Bands are a popular technical analysis tool used by day traders to analyze price volatility and identify potential trading opportunities. By understanding how to effectively implement Bollinger Bands in your day trading strategies, you can improve your overall trading performance and increase your chances of making profitable trades.
What are Bollinger Bands?
Bollinger Bands consist of a simple moving average (typically 20 periods) and two standard deviation lines positioned above and below the moving average. The standard deviation lines provide a measure of volatility, while the moving average helps to identify the trend.
Read Also: The effectiveness of pure price action trading: does it work? - Expert analysis and insights
Using Bollinger Bands in day trading
When using Bollinger Bands in day trading, it is important to consider both the price action and the position of the price relative to the bands. The following are some effective strategies that can be used:
1. Bollinger Squeeze
The Bollinger Squeeze strategy involves waiting for the bands to narrow, indicating low volatility, followed by a breakout in price. This can indicate a potential reversal or a continuation of the current trend. Traders can look for price breakouts above or below the bands to enter a trade.
Read Also: Step-by-step guide: How to fill out a forex card
2. Bollinger Breakout
The Bollinger Breakout strategy involves waiting for a breakout in price outside of the bands, indicating high volatility. This can be a signal for a potential trend reversal or the start of a new trend. Traders can look for breakouts above or below the bands as an entry signal.
3. Bollinger Reversal

The Bollinger Reversal strategy involves looking for price reversals when it reaches the upper or lower band. If the price reaches the upper band, it may indicate an overbought condition and a potential reversal to the downside. Conversely, if the price reaches the lower band, it may indicate an oversold condition and a potential reversal to the upside.
Conclusion
Bollinger Bands can be a powerful tool in day trading strategies, allowing traders to analyze volatility and identify potential trading opportunities. By implementing effective strategies such as the Bollinger Squeeze, Bollinger Breakout, and Bollinger Reversal, traders can increase their chances of making profitable trades. It is important to practice and backtest these strategies before implementing them in live trading to ensure consistency and effectiveness.
Bollinger Bands are a technical analysis tool that consists of a moving average line and two standard deviation lines above and below it.
Bollinger Bands can be used for day trading by helping traders identify potential entry and exit points based on price volatility and trend reversals.
Bollinger Bands help identify price volatility by expanding during periods of high volatility and contracting during periods of low volatility.
Some day trading strategies that can be used with Bollinger Bands include the Bollinger Squeeze, Bollinger Band Breakouts, and Bollinger Band Reversals.
Yes, Bollinger Bands can be used for other trading timeframes such as swing trading or long-term investing, as they help identify potential market reversals.
Bollinger Bands are a technical analysis tool that is used to measure the volatility of a stock or other financial instrument. They consist of three lines: a simple moving average (SMA) in the middle, and an upper band and a lower band that are calculated based on standard deviations from the SMA.

Cost of Moving from LA to Hawaii Planning a move from Los Angeles to Hawaii can be an exciting adventure, but it’s important to consider the cost of …
Read Article
Forex Trading in African Countries: A Comprehensive Overview Forex trading has gained significant popularity in Africa over the past decade, with more …
Read Article
How Do FX Traders Make Money? Foreign exchange trading (FX trading), also known as forex trading, is the buying and selling of currencies on the …
Read Article
Is there a monthly fee for e trade? If you’re considering using E-Trade for your online trading needs, you may be wondering whether or not there is a …
Read Article
Is this phone 4G or 3G? With the rapid advancement of technology, it can be difficult to keep up with the latest developments in the world of mobile …
Read Article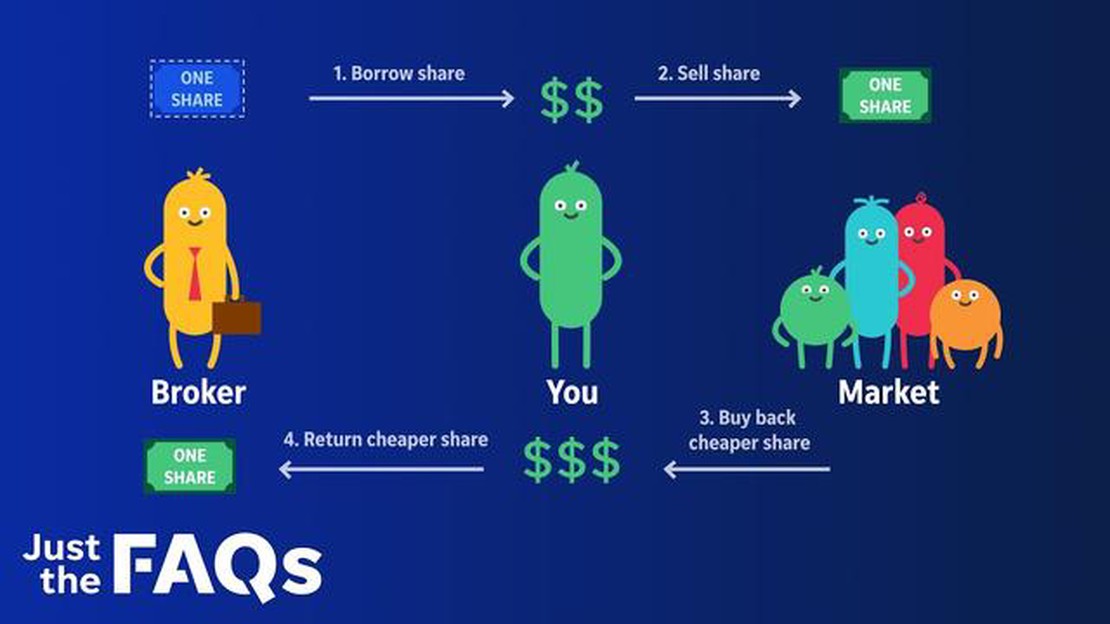
Duration of Short Squeezes: Exploring the Timeframe A short squeeze is a market phenomenon that occurs when there is a rapid increase in the price of …
Read Article


