


Are Options Available for Penny Stocks: Exploring the Possibilities
Are Penny Stocks Eligible for Options Trading? Penny stocks are often seen as an attractive investment option due to their affordable price per share. …
Read Article
When it comes to technical analysis in the world of trading, triangle patterns are one of the most commonly discussed and analyzed formations. These patterns can provide important insights into the future direction of an asset’s price movement. Whether they are bullish or bearish, understanding triangle patterns can be a valuable skill for traders seeking to make informed decisions.
Triangle patterns are formed when the price of an asset oscillates between a series of lower highs and higher lows, creating a converging triangular shape on a price chart. This consolidation phase often occurs after a strong price move in one direction, signaling a temporary pause or indecision in the market. The two main types of triangle patterns are ascending triangles and descending triangles, each with its own implications for future price movement.
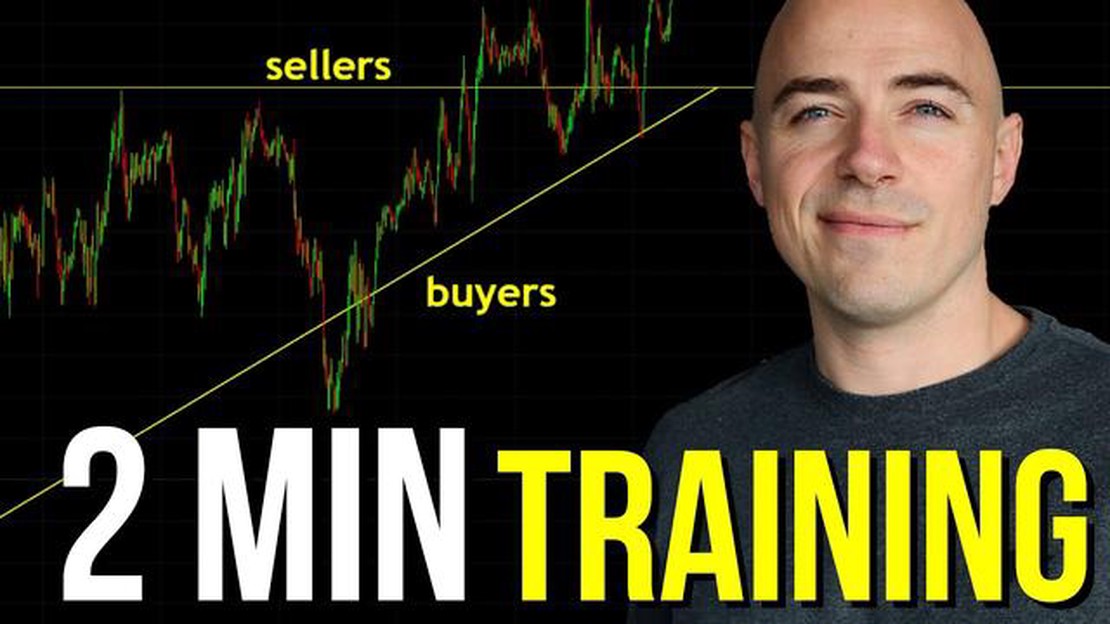
An ascending triangle pattern is characterized by a flat upper trendline and a rising lower trendline. This formation suggests that buyers are becoming increasingly more aggressive, consistently pushing the price higher and creating higher lows. Eventually, the price breaks above the upper trendline, indicating a potential bullish breakout and a continuation of the previous upward trend.
On the other hand, a descending triangle pattern features a descending upper trendline and a flat lower trendline. This pattern suggests that sellers are gaining control, consistently pushing the price lower and creating lower highs. When the price breaks below the lower trendline, it indicates a potential bearish breakout and a continuation of the previous downward trend.
In conclusion, understanding triangle patterns in trading is crucial for identifying potential bullish or bearish trading opportunities. By carefully analyzing the formation of these patterns, traders can gain valuable insights into future price movements and make more informed trading decisions. Whether it’s an ascending triangle or a descending triangle, being able to identify and interpret these patterns can greatly enhance a trader’s chances of success in the market.
Triangle patterns are a common occurrence in technical analysis and can provide important insights into the future direction of a security’s price. These patterns are formed when the price of a security moves between two converging trendlines, creating a triangular shape on the price chart.
There are three main types of triangle patterns: ascending triangles, descending triangles, and symmetrical triangles.

Traders and investors closely monitor triangle patterns as they can provide important signals for potential price reversals or continuations. These patterns can be combined with other technical analysis tools and indicators to confirm signals and make more informed trading decisions.
It is important to note that triangle patterns should be used in conjunction with other forms of analysis, such as trendlines, support and resistance levels, and volume indicators, to increase the reliability of the signals they provide. Additionally, it is advisable to wait for a confirmed breakout from the triangle pattern before making any trading decisions.
A triangle pattern is a technical analysis pattern that can indicate a potential trend reversal or continuation in the price of a security. When it comes to trading, identifying bullish triangle patterns can be useful for traders looking to take advantage of upward price movements.
Bullish triangle patterns are typically characterized by a series of higher lows and relatively equal highs, forming a triangle shape that slopes upward. This indicates that buyers are entering the market at higher prices, creating higher lows, while sellers are not able to push the price down significantly, resulting in equal highs.
Read Also: Understanding Stock Options for New Hires: A Comprehensive Guide
There are three common types of bullish triangle patterns:
Ascending triangle: In an ascending triangle pattern, the upper trendline acts as a resistance level, while the lower trendline acts as a support level. The price tends to break out above the upper trendline, indicating a potential bullish continuation.
Read Also: Understanding the Distinction: QSO vs Nqso Explained
Symmetrical triangle: In a symmetrical triangle pattern, the upper trendline acts as a resistance level, while the lower trendline acts as a support level. The price can break out in either direction, but a breakout to the upside indicates a potential bullish continuation.
Pennant: A pennant pattern is similar to a symmetrical triangle pattern, with the main difference being that the pennant has converging trendlines that form a small flag-shaped pattern. A breakout to the upside indicates a potential bullish continuation.
To identify a bullish triangle pattern, traders can draw trendlines connecting the higher lows and equal highs. Once the pattern is formed, traders can wait for a breakout above the upper trendline as confirmation of a potential bullish continuation.
It’s important to note that triangle patterns can also fail, resulting in a potential reversal or continuation in the opposite direction. Traders should always use other technical analysis tools, such as volume indicators or oscillators, to confirm the validity of the pattern before making trading decisions.

Triangle patterns in trading are chart patterns formed by price bars that consolidate into a triangular shape. They represent a period of indecision in the market where buyers and sellers are closely matched.
Triangle patterns can provide potential insights into future market trends. Depending on the direction of the breakout from the triangle, they can be indicative of either bullish or bearish trends.
A bullish triangle pattern is characterized by a series of higher lows and relatively equal highs. It indicates that buyers are gaining strength and might soon push the price higher.
A bearish triangle pattern is identified by a series of lower highs and relatively equal lows. It suggests that sellers are becoming more dominant and could potentially drive the price lower.
Triangle patterns may provide a price target based on the height of the triangle. Traders often measure the distance from the highest to the lowest point of the triangle and project it from the point of breakout to estimate a potential price target.

Are Penny Stocks Eligible for Options Trading? Penny stocks are often seen as an attractive investment option due to their affordable price per share. …
Read Article
Best Option Strategy for Low Volatility When it comes to trading in the stock market, volatility can be both a blessing and a curse. While high …
Read Article
Cost of Autopilot Trading App: A Complete Breakdown The emergence of autopilot trading apps has revolutionized the way people invest in financial …
Read Article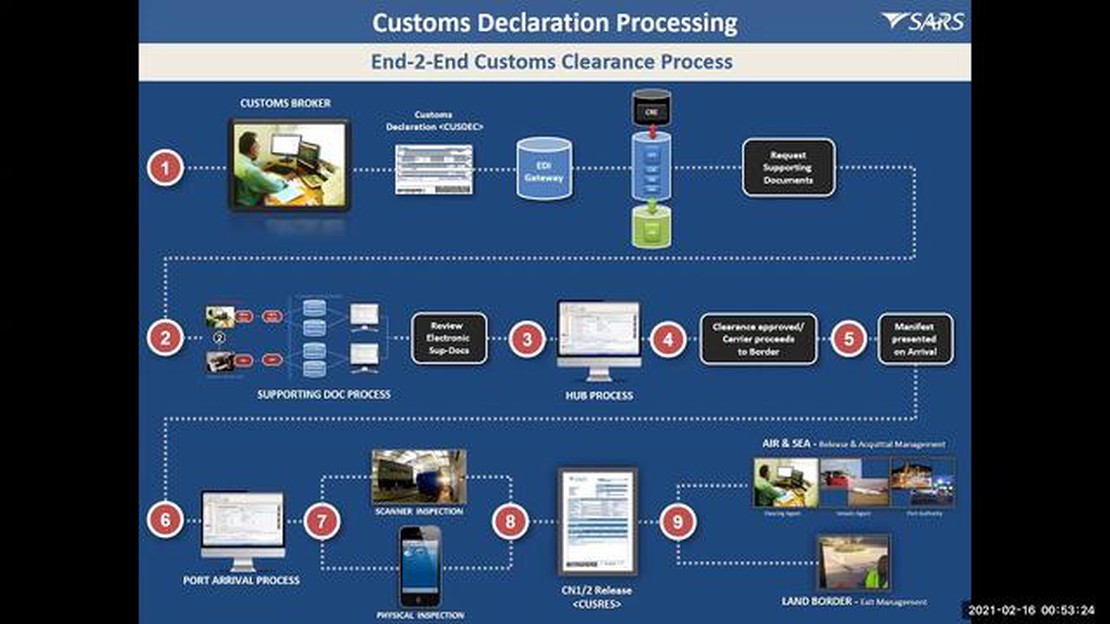
Understanding Tax Obligations for Trading in South Africa Trading in South Africa can be a lucrative venture, but it is important for traders to …
Read Article
Is 32GB RAM overkill for work? When it comes to determining the ideal amount of RAM for work, many factors come into play. RAM, or Random Access …
Read Article
Exchange Rate Fee for Nordea Are you planning to travel abroad and wondering how much it will cost you to exchange your currency at Nordea Bank? In …
Read Article


