


Is Czarina Foreign Exchange Legit? Find Out the Truth Here
Is Czarina Foreign Exchange legit? When it comes to foreign exchange, it’s essential to find a reliable and trustworthy company. One such company that …
Read Article
Japanese candlestick patterns are a popular tool used by traders to analyze and predict market movements. These patterns provide valuable insights into the psychology of market participants and can help traders make more informed decisions.
There are several types of candlestick patterns, each with its own unique interpretation. The most basic pattern is the doji, which represents indecision in the market. A doji occurs when the open and close prices are equal or very close, resulting in a small or non-existent body and long upper and lower wicks. Traders interpret the presence of a doji as a sign that the market is undecided and may be preparing for a reversal.
Another popular candlestick pattern is the hammer, which is characterized by a long lower wick and a relatively short body. This pattern usually occurs at the bottom of a downtrend and suggests that buyers are stepping in and pushing prices higher. Conversely, the hanging man pattern is similar to the hammer, but occurs at the top of an uptrend. It indicates that sellers are starting to take control and may lead to a reversal.
Other important candlestick patterns include the engulfing pattern, which occurs when a small candle is completely engulfed by the following candle, and the shooting star pattern, which has a long upper wick and a small body. These patterns can provide valuable insights into the market’s sentiment and can help traders identify potential reversals or continuation patterns.
Understanding and interpreting candlestick patterns is an essential skill for any trader looking to improve their decision-making process. By studying the various patterns and their meanings, traders can gain a deeper understanding of market dynamics and increase their chances of success.
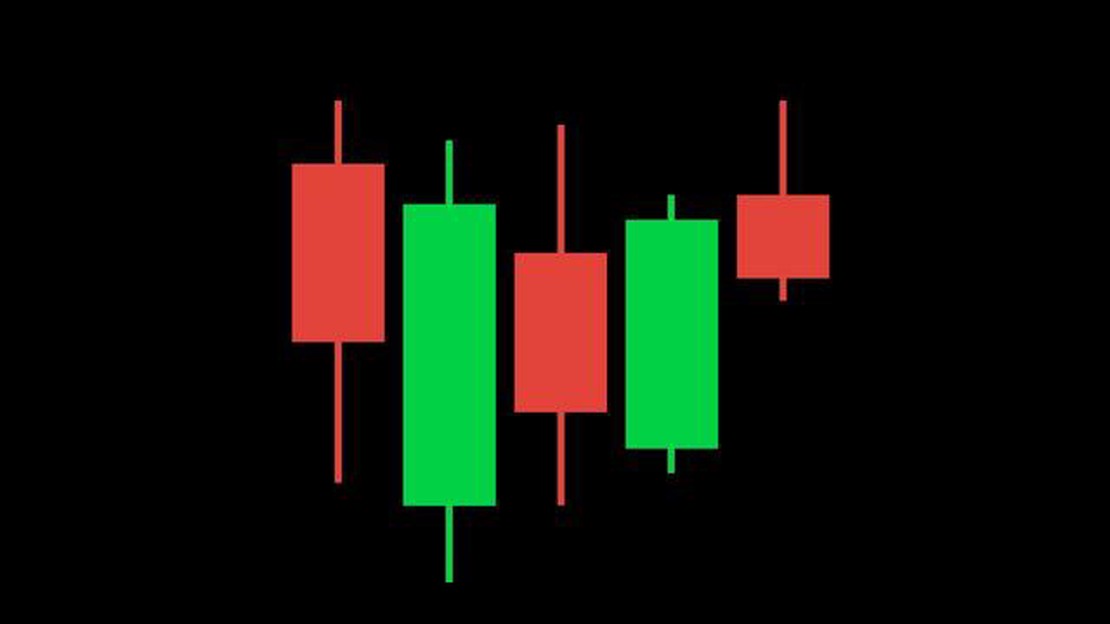
Japanese candlesticks are a popular form of technical analysis used by traders to evaluate patterns in price movements. Candlestick charts provide valuable information about the open, high, low, and close prices of a financial instrument for a given time period.
The candlestick chart consists of individual “candles” that represent a specific time period, such as a day, a week, or an hour. Each candlestick has a body and two wicks, or shadows, extending from the body. The body represents the difference between the opening and closing prices, while the wicks represent the range between the high and low prices.
Candlesticks come in different colors, typically green or white for bullish (upward) movements and red or black for bearish (downward) movements. The color of the candlestick can vary depending on the specific charting platform or trading software being used.
There are several basic candlestick patterns that traders often look for in charts to make trading decisions. These patterns include the doji, hammer, shooting star, engulfing pattern, and spinning top, among others. Each pattern provides insights into the market sentiment and potential reversal or continuation of a trend.
It’s important to note that candlestick patterns should not be used in isolation but rather in conjunction with other technical indicators and market analysis techniques. Traders should also consider the overall market conditions and other factors that may impact price movements.

By understanding the basics of Japanese candlesticks and the different patterns they form, traders can gain a deeper insight into market dynamics and make more informed trading decisions. It is recommended to practice reading and analyzing candlestick charts using historical data and to seek further education and guidance before implementing any trading strategies.
Japanese candlestick charts are widely used by traders to identify potential price reversals and market trends. Candlestick patterns provide valuable information about market sentiment and can help predict future price movements. In this section, we will explore some of the most common candlestick patterns and what they indicate.
Read Also: Understanding the Types of Options Traded on NSE - A Comprehensive Guide
5. Morning Star: The morning star is a bullish reversal pattern that consists of three candlesticks. The first candlestick is bearish, followed by a small bullish or bearish candlestick (the “star”), and then a larger bullish candlestick. This pattern often signals the end of a downtrend and the start of a new uptrend.
These are just a few of the many candlestick patterns that traders use to analyze price movements and make trading decisions. It is important to remember that candlestick patterns should not be used in isolation but should be considered alongside other technical indicators and analysis tools. Understanding these patterns can help traders gain a better understanding of market dynamics and increase the likelihood of making successful trades.
Japanese candlestick patterns are important tools for technical analysis in trading. They provide insights into the market sentiment and help traders make informed decisions. In addition to the basic candlestick patterns, there are several advanced patterns that can provide even more valuable information.
Read Also: What is the minimum withdrawal on Axiory?2. Bearish Engulfing Pattern: This pattern is the opposite of the bullish engulfing pattern. It occurs when a small bullish candlestick is followed by a larger bearish candlestick that engulfs the previous candlestick’s body. It indicates a strong reversal from bullish to bearish and suggests that sellers have taken control of the market. 3. Hammer: The hammer is a bullish reversal pattern that has a small body and a long lower shadow. It suggests that buyers were able to regain control after an initial sell-off. The long lower shadow indicates that sellers tried to push the price lower, but failed.
 4. Shooting Star: The shooting star is a bearish reversal pattern that has a small body and a long upper shadow. It suggests that sellers were able to regain control after an initial rally. The long upper shadow indicates that buyers tried to push the price higher, but failed.
5. Doji: The doji is a reversal pattern that has a small body and no or very small shadows. It indicates indecision in the market and suggests a possible reversal in the current trend. A bullish doji occurs when the opening and closing prices are close to each other, and a bearish doji occurs when the opening and closing prices are also close to each other, but below the previous candlestick’s body.
4. Shooting Star: The shooting star is a bearish reversal pattern that has a small body and a long upper shadow. It suggests that sellers were able to regain control after an initial rally. The long upper shadow indicates that buyers tried to push the price higher, but failed.
5. Doji: The doji is a reversal pattern that has a small body and no or very small shadows. It indicates indecision in the market and suggests a possible reversal in the current trend. A bullish doji occurs when the opening and closing prices are close to each other, and a bearish doji occurs when the opening and closing prices are also close to each other, but below the previous candlestick’s body.
These are just a few examples of the advanced candlestick patterns available to traders. By studying and understanding these patterns, traders can improve their ability to analyze market trends and make more accurate predictions.
Japanese candlesticks are a method of charting the price movement of an asset in financial markets. They were developed in Japan in the 18th century and have become widely used by traders around the world. Each candlestick represents a specific period of time and displays the opening, closing, high, and low prices for that period.
Different candlestick patterns indicate different market trends and potential reversals. For example, a bullish candlestick pattern, such as a hammer or engulfing pattern, suggests that the market is likely to move upwards. On the other hand, a bearish candlestick pattern, like a shooting star or hanging man, indicates that the market may move downwards. Traders use these patterns to make predictions about future price movements.
The color of a candlestick depends on whether the closing price is higher or lower than the opening price. A green or white candlestick represents a bullish or positive movement, where the closing price is higher than the opening price. A red or black candlestick, on the other hand, indicates a bearish or negative movement, where the closing price is lower than the opening price. The color provides visual cues to traders about the sentiment of the market.
Traders can use Japanese candlestick patterns in their analysis to identify potential entry and exit points in the market. By recognizing specific patterns, traders can make more informed decisions about when to buy or sell an asset. Additionally, candlestick patterns can help traders determine the strength of a trend and whether it may reverse. This information can be used to manage risk and improve overall trading performance.
No, Japanese candlestick patterns are not always accurate. While they can provide valuable insights into market trends and potential reversals, they should not be relied upon as the sole basis for making trading decisions. Traders should use candlestick patterns in conjunction with other technical indicators and analysis to confirm their predictions. As with any form of technical analysis, it’s important to use multiple tools and consider other factors when making trading decisions.
Japanese candlesticks are a graphical representation of price movements in the financial markets, typically used for technical analysis of stocks, currencies, and commodities. They are named “candlesticks” because their shape resembles that of a candle. Each candlestick displays the opening, closing, high, and low prices for a specific time period.

Is Czarina Foreign Exchange legit? When it comes to foreign exchange, it’s essential to find a reliable and trustworthy company. One such company that …
Read Article
How much money do equity traders make? Equity trading is a lucrative field that attracts many individuals with its promise of high earning potential. …
Read Article
How much do forex bankers make? When it comes to the world of finance, forex banking is one of the most sought-after and lucrative professions. Forex …
Read Article
Best Places to Find White Papers The world of white papers is vast and diverse, offering valuable insights and knowledge on a wide range of topics. …
Read Article
Understanding the 2 Point Moving Average Data analysis is an essential part of understanding and interpreting data, and there are various techniques …
Read Article
Where can I find a valid promo code? In today’s fast-paced world, everyone loves a good deal. Whether you’re shopping online or in-store, finding a …
Read Article


