

How to effectively use moving average for entry in trading
Using Moving Average for Entry: A Comprehensive Guide When it comes to trading in financial markets, having a well-defined entry strategy is crucial. …
Read Article

The TMA Moving Average Indicator is a powerful tool that can help traders identify trends and make informed trading decisions. TMA stands for Triple Moving Average, which means it is based on three moving averages: the upper, middle, and lower bands. This indicator is widely used in technical analysis and is known for its ability to smooth out price fluctuations and provide reliable signals.
The TMA Moving Average Indicator works by calculating the average price over a specific period of time, usually using the closing price. The upper and lower bands are calculated by multiplying the standard deviation of the price with a factor and adding or subtracting it from the middle band. This creates a channel around the moving average, which helps traders identify potential support and resistance levels.
One of the key advantages of the TMA Moving Average Indicator is its ability to adapt to different market conditions. The indicator responds quickly to changes in price volatility, which makes it particularly useful during periods of high market volatility. Traders can use this information to anticipate future price movements and adjust their trading strategies accordingly.
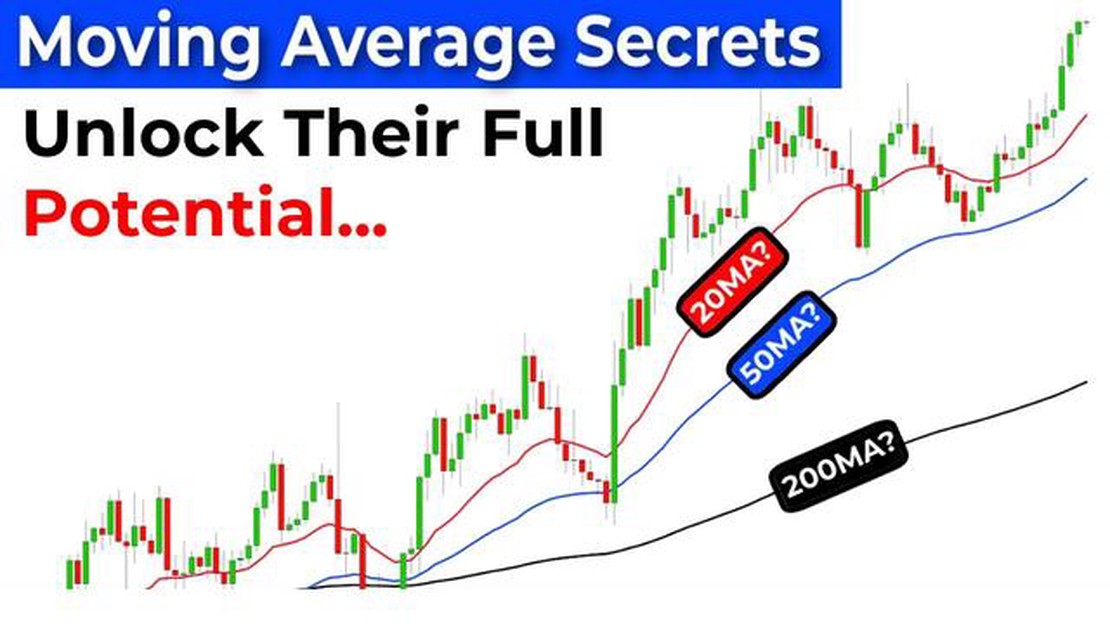
When using the TMA Moving Average Indicator, it’s important to consider both the direction of the moving average and the position of the price within the bands. A rising moving average indicates an uptrend, while a falling moving average indicates a downtrend. Traders can look for buying opportunities when the price is near the lower band during an uptrend and selling opportunities when the price is near the upper band during a downtrend.
In addition to identifying trends and potential entry and exit points, the TMA Moving Average Indicator can also be used to confirm other technical indicators and trading signals. For example, if a trader sees a bullish candlestick pattern near the lower band during an uptrend, it can provide additional confirmation that a buying opportunity is present.
However, it’s important to remember that no indicator is infallible, and traders should always use multiple indicators and analysis techniques to make informed trading decisions. The TMA Moving Average Indicator is just one tool in a trader’s arsenal, and it should be used in conjunction with other indicators and analysis methods to increase the likelihood of successful trades.
The TMA (Triangular Moving Average) Moving Average Indicator is a popular technical analysis tool used by traders to identify trends in the financial markets. It is a type of moving average that focuses on smoothing out price fluctuations and highlighting the overall direction of the market.

The TMA Moving Average Indicator uses a mathematical formula to calculate the average price over a specified period of time. Unlike traditional moving averages, which give equal weight to all data points, the TMA gives greater weight to the most recent price data, making it more responsive to changes in market conditions.
One of the main advantages of the TMA Moving Average Indicator is its ability to provide traders with a clearer and more accurate picture of market trends. By smoothing out price movements, it helps to filter out noise and identify the underlying direction of the market.
The TMA Moving Average Indicator is also highly versatile and can be used in various ways. Traders can use it to determine trend reversals, identify support and resistance levels, and generate buy or sell signals. It can be applied to different timeframes, from short-term intraday charts to long-term weekly or monthly charts.
To effectively use the TMA Moving Average Indicator, it is important to understand its characteristics and how it behaves in different market conditions. Traders should consider factors such as the length of the moving average, the sensitivity to price changes, and the confirmation from other technical indicators before making trading decisions.
Read Also: Unleash Your Inner Musician: Master These 3 Chords to Play Any Song!
In conclusion, the TMA Moving Average Indicator is a powerful tool that can help traders identify trends and make more informed trading decisions. By understanding its characteristics and using it effectively, traders can gain a competitive edge in the financial markets.
The TMA Moving Average Indicator is a technical analysis tool used by traders and investors to analyze the price movements of a financial asset over a specified period of time. TMA stands for Triple Moving Average, which means that it is calculated based on three different moving averages.
Unlike traditional moving averages, the TMA Moving Average Indicator places greater weight on recent price data, making it more responsive to changes in the market. This makes it a popular choice among traders who want to capture short-term price movements.
The TMA Moving Average Indicator is displayed as a line on a price chart, and it is often used in conjunction with other technical indicators and chart patterns to confirm trading signals and identify potential buy or sell opportunities.
Traders can adjust the TMA Moving Average Indicator’s settings to fit their specific trading style and time frame. The indicator’s parameters include the period length, which determines the number of bars used in the calculation, and the source data, such as the closing price or the average of the high and low prices.
By analyzing the slope and direction of the TMA Moving Average line, traders can get insights into the overall trend of the market, as well as potential levels of support and resistance. It can be used to generate various trading strategies, such as trading breakouts or trend reversals.
Read Also: Exploring the Extensive Range of Vegan Options at Trader Joe's
It is important to note that the TMA Moving Average Indicator is not a standalone tool and should be used in combination with other technical analysis tools and market research. It is also recommended to backtest any trading strategy using historical data before applying it to live trading.
In conclusion, the TMA Moving Average Indicator is a versatile tool that can help traders identify trends and potential trading opportunities in the market. It is a powerful analytical tool that should be used in conjunction with other indicators and analysis techniques to make informed trading decisions.
The TMA Moving Average indicator is a technical analysis tool used to smooth out price fluctuations and identify trends in the market. It is based on the idea that prices are mean-reverting and tend to move towards the average over time.
The TMA Moving Average indicator is calculated by taking the average of the current price and the price over a specified period, and then adjusting it for volatility. It uses a weighted moving average to give more weight to recent prices and less weight to older prices, thereby providing a more accurate representation of the current market trend.

The main difference between the TMA Moving Average and other moving average indicators is the way it adjusts for volatility. While traditional moving averages give equal weight to all prices, the TMA Moving Average adjusts the weights based on the volatility of the market, providing a smoother and more accurate representation of the current trend.
To effectively use the TMA Moving Average indicator, it is important to consider the overall trend direction and the crossovers of the TMA line with price. When the TMA line is trending upward and crosses above the price, it is a bullish signal indicating a potential buying opportunity. Conversely, when the TMA line is trending downward and crosses below the price, it is a bearish signal indicating a potential selling opportunity.
Yes, the TMA Moving Average indicator can be used for day trading. Traders can use it to identify short-term trends and potential reversal points. By combining the TMA Moving Average with other technical indicators and trading strategies, day traders can make informed decisions and increase their chances of success in the market.
The TMA Moving Average Indicator is a technical indicator used in financial market analysis. It is a type of moving average that is derived from the combination of three different moving averages: the simple moving average (SMA), the weighted moving average (WMA), and the exponential moving average (EMA). The TMA Moving Average Indicator is designed to filter out noise and provide a more accurate picture of the overall trend in the market.
The TMA Moving Average Indicator works by calculating the average price over a specified period of time, but it places more weight on recent prices. It does this by giving more weight to the most recent data points and gradually decreasing the weight of older data points. This helps to capture short-term trends and filter out noise from the market. The TMA Moving Average Indicator can be used to identify the direction of the trend and generate buy or sell signals.

Using Moving Average for Entry: A Comprehensive Guide When it comes to trading in financial markets, having a well-defined entry strategy is crucial. …
Read Article
Amibroker’s Programming Language: What Language Does Amibroker Use? Amibroker is a popular technical analysis software used by traders and investors …
Read Article
Minimum Deposit for Nadex Binary Options When it comes to trading binary options on the Nadex platform, one of the key factors to consider is the …
Read Article
Is Forex Trading a Lucrative Way to Make Money? In the world of investing and financial markets, forex trading has become increasingly popular. Many …
Read Article
Understanding the Distinction between Forex and FX Trading Foreign exchange, commonly known as Forex or FX, plays a significant role in the global …
Read Article
How to Calculate a Weighted Average: Examples and Formulas Calculating a weighted average is a fundamental mathematical concept that is used in …
Read Article


