
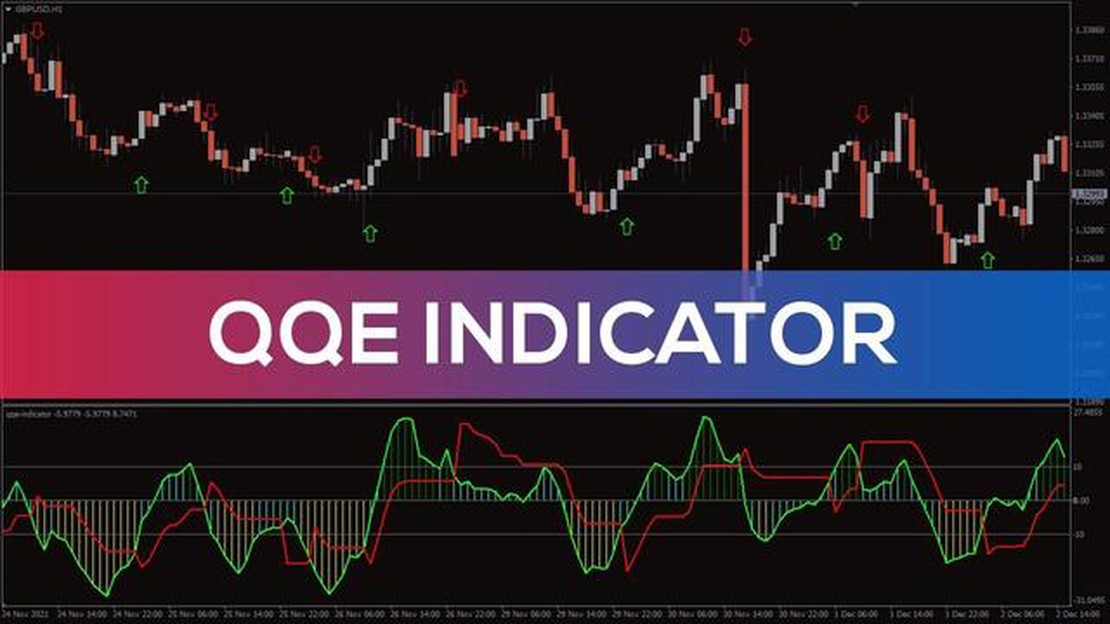

Discover the Power of QQE Signals Indicator MT4 for Accurate Trading Signals
Understanding the QQE Signals Indicator MT4: A Comprehensive Guide When it comes to trading in the forex market, accurate trading signals can make all …
Read Article
In the world of financial markets, understanding and analyzing trends is crucial for investors and traders. One widely used tool for trend analysis is the 200-day moving average. This indicator, derived from the average price over the past 200 trading days, provides valuable insights into the overall direction of a market or security.
The 200-day moving average serves as a guide for market participants to identify the long-term trend of a financial instrument. It smooths out short-term fluctuations and noise, allowing investors to focus on the bigger picture. When the price is above the 200-day moving average, it indicates an uptrend, while a price below suggests a downtrend.
Traders often use the 200-day moving average as a key level of support or resistance. When the price approaches the moving average from below, it may find support and bounce higher. On the other hand, if the price approaches the moving average from above, it may encounter resistance and reverse lower.
Moreover, the 200-day moving average is widely watched by institutional investors, as it is considered a significant psychological level. Many investors use this indicator to make investment decisions, which can result in increased buying or selling pressure when the price approaches or crosses this moving average.
The 200-day moving average is a commonly used technical indicator in financial markets. It is a calculation that helps investors and traders analyze the overall trend of a financial security over a longer period of time.
| Key Points about the 200-day Moving Average: |
|---|
| The 200-day moving average is calculated by taking the sum of the closing prices of a security over the past 200 trading days and dividing it by 200. |
| It is often used as a support or resistance level, indicating the average price at which an asset has traded over the past 200 days. |
| Investors and traders analyze the 200-day moving average to identify trends and potential entry or exit points in the market. |
| Crossings of the 200-day moving average by the price of a security are considered significant indicators of a change in the overall trend. |
| When the price crosses above the 200-day moving average, it is seen as a bullish signal, suggesting that the trend is shifting upwards. |
| On the other hand, when the price crosses below the 200-day moving average, it is seen as a bearish signal, indicating that the trend is shifting downwards. |
The 200-day moving average is considered a longer-term indicator compared to shorter-term moving averages such as the 50-day or 20-day moving average. It is frequently used by investors and traders to confirm the direction of the overall trend before making buying or selling decisions.
It is important to note that the 200-day moving average should not be used in isolation and should be combined with other technical indicators and fundamental analysis for a more comprehensive understanding of the market.

The 200-day moving average is a technical indicator used in financial markets to analyze the overall trend of a security or market index. It is calculated by taking the average closing price of a security or market index over the past 200 trading days, with each day given equal weight.
The 200-day moving average is often used by traders and investors to identify long-term trends and significant levels of support and resistance. It helps to smooth out short-term price fluctuations and provide a clearer picture of the underlying trend.
Read Also: Where to Find White Papers: A Comprehensive Guide
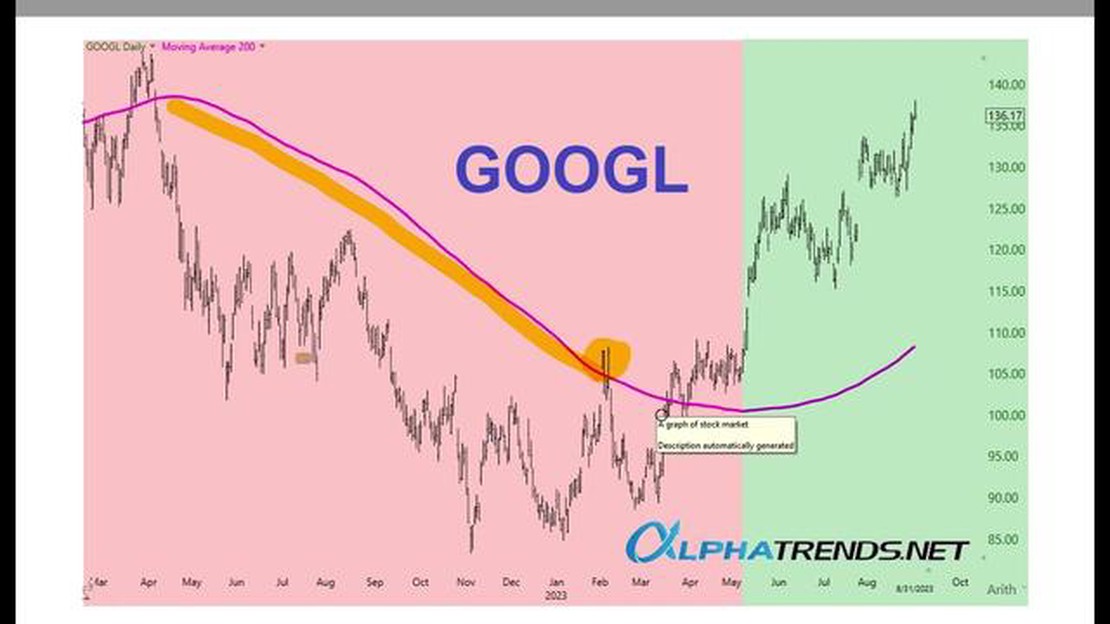
When the price of a security or market index is above its 200-day moving average, it is typically considered to be in an uptrend. This suggests that buyers are in control and that the price is more likely to continue rising. Conversely, when the price is below its 200-day moving average, it is generally seen as a sign of a downtrend, indicating that sellers have the upper hand and the price is more likely to keep falling.
The 200-day moving average can also act as a support or resistance level. If the price of a security or market index falls towards its 200-day moving average during an uptrend, it may find support at this level and bounce back up. Similarly, if the price approaches the 200-day moving average from below during a downtrend, it may encounter resistance and struggle to break above it.
Traders and investors often use the 200-day moving average in conjunction with other technical indicators and chart patterns to make more informed trading decisions. It can be applied to various timeframes, from daily to weekly or monthly charts, depending on the investor’s preferred time horizon.
Overall, the 200-day moving average is a widely followed indicator in financial markets due to its ability to provide a clear and objective measure of the long-term trend. By analyzing the relationship between the price and its 200-day moving average, traders and investors can gain valuable insights into the market dynamics and adjust their strategies accordingly.
The 200-day moving average is a widely used metric in financial markets and is considered a critical indicator for long-term trend analysis. It is used to measure the average price of a security over a 200-day period, enabling investors and traders to assess the overall direction of the market.
One of the main reasons why the 200-day moving average is significant is its ability to smooth out short-term fluctuations and provide a clearer picture of the underlying trend. By averaging the price over a longer period, it helps to filter out noise and identify the primary direction in which the security is moving.
Read Also: Are exercised stock options considered taxable income?
Furthermore, the 200-day moving average acts as a support or resistance level for the security’s price. When the price is trading above the 200-day moving average, it is considered to be in an uptrend, indicating bullish sentiment. Conversely, when the price is trading below the 200-day moving average, it signals a downtrend and bearish sentiment in the market.
Moreover, the 200-day moving average is used as a tool for determining potential buy or sell signals. When the price crosses above the 200-day moving average, it is considered a bullish signal, suggesting a possible buying opportunity. On the other hand, if the price crosses below the 200-day moving average, it is seen as a bearish signal, indicating a potential selling opportunity.

In addition to its significance in trend analysis and buy/sell signals, the 200-day moving average is also used as a reference point for risk management. Traders often use it as a stop-loss level, setting their stop orders just below the 200-day moving average to limit their losses in case the trend reverses.
Overall, the 200-day moving average plays a crucial role in financial markets as it helps investors and traders analyze trends, identify potential trading opportunities, and manage their risks effectively. Its ability to smooth out short-term fluctuations and provide a clear view of the market’s direction makes it an essential tool for market participants.
| Pros | Cons |
|---|---|
| Helps identify long-term trends | May lag behind significant market changes |
| Filters out short-term noise | Can generate false signals in volatile markets |
| Acts as a support/resistance level | Not suitable for short-term traders |
| Provides buy/sell signals | Requires a longer time frame for analysis |
| Used for risk management | May not work well in certain market conditions |
The 200-day moving average is a technical indicator used in financial markets to analyze the overall trend of a stock or index over a longer period of time. It is calculated by adding up the closing prices of a stock or index over the past 200 trading days and dividing it by 200. It is then plotted on a chart to provide a visual representation of the stock or index’s trend.
The 200-day moving average is used as a tool to determine the direction of the market trend. Traders and investors often use it to identify potential buy or sell signals. When the price of a stock or index is above its 200-day moving average, it is considered to be in an uptrend, and when the price is below the 200-day moving average, it is considered to be in a downtrend.
The 200-day moving average is considered to be a reliable indicator by many traders and investors. It is widely used in technical analysis and has been proven to be effective in identifying long-term trends. However, like any indicator, it is not foolproof and should be used in conjunction with other analysis tools and indicators for more accurate results.
The 200-day moving average can help investors make investment decisions by providing them with an idea of the overall trend of a stock or index. If the price of a stock or index is consistently above its 200-day moving average, it may be a bullish signal and indicate that the stock or index is in an uptrend. On the other hand, if the price is consistently below the 200-day moving average, it may be a bearish signal and indicate that the stock or index is in a downtrend.

Understanding the QQE Signals Indicator MT4: A Comprehensive Guide When it comes to trading in the forex market, accurate trading signals can make all …
Read Article
CHF JPY exchange rate forecast The CHF JPY prediction is a topic of great interest for currency investors and traders. Both the Swiss franc (CHF) and …
Read Article
Is Transferwise available in Singapore? TransferWise is a popular online money transfer service that allows users to send and receive money across …
Read Article
What is E8 in forex? The forex market is a vast and complex world, with countless strategies and techniques that traders use to analyze and predict …
Read Article
AED to USD Buying Rate Today If you are planning to exchange your UAE Dirham (AED) to US Dollar (USD), it is crucial to stay updated on the current …
Read Article
Representing a System in a Use Case Diagram A use case diagram is a powerful tool for visualizing and documenting the interactions between different …
Read Article


