


Understanding the Strangle Options Trading Strategy
Understanding Strangle Options Trading Strategy The strangle options trading strategy is a popular technique used by traders to profit from volatility …
Read Article
The Relative Strength Index (RSI) is a popular technical indicator used by traders to assess the strength of an asset’s price movement. It is a momentum oscillator that measures the speed and change of price movements, providing insights into overbought and oversold conditions. The RSI is widely used in various trading strategies, and understanding its different settings is crucial for successful trading.
One of the settings that traders often utilize is RSI 2. RSI 2 refers to using a period of 2 in the calculation of the RSI indicator. This setting is known for its ability to identify short-term overbought and oversold levels more accurately. By using a shorter period, RSI 2 reacts faster to price changes, providing traders with timely signals.
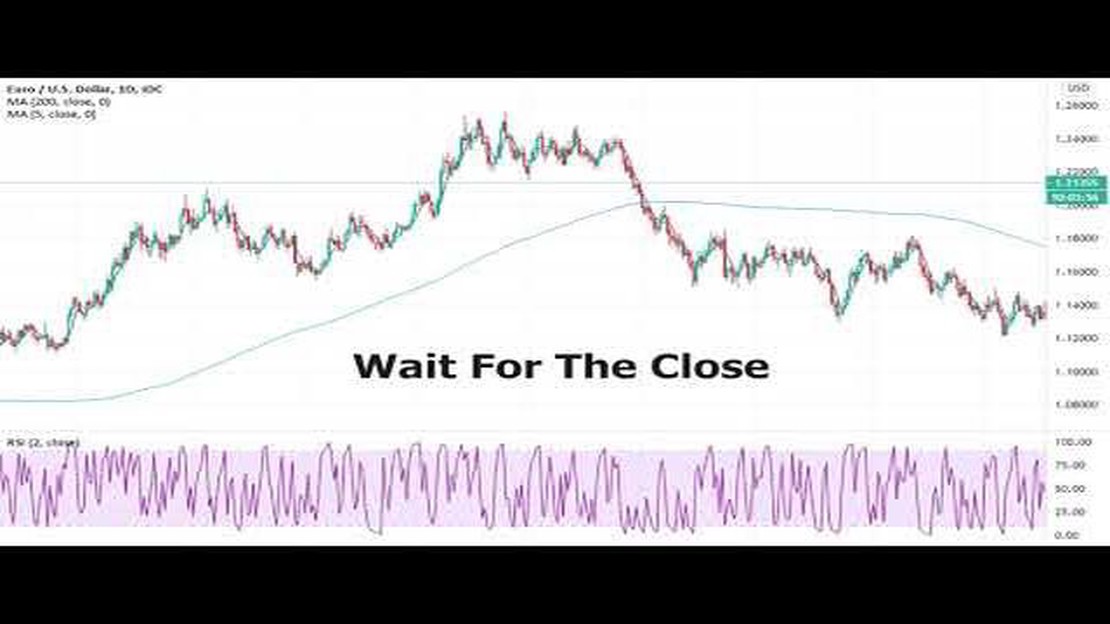
When the RSI 2 is above the overbought level, typically set at 70, it suggests that the asset is overvalued, and a reversal or pullback may occur. Conversely, when the RSI 2 drops below the oversold level, typically set at 30, it indicates that the asset may be undervalued, and a potential rebound could happen. This information can be valuable for traders looking to enter or exit positions.

However, it’s essential to note that while RSI 2 can be a useful tool, it should not be used in isolation. Traders need to consider other indicators, market conditions, and risk management strategies to make informed trading decisions. Additionally, different assets and timeframes may require adjustments to the RSI 2 setting for optimal results. It’s crucial to backtest and experiment with various settings to find what works best for your trading style.
In conclusion, understanding the RSI 2 setting is valuable for traders looking to incorporate the RSI indicator into their trading strategy. By utilizing a shorter period, RSI 2 provides more timely signals and enhances the accuracy of identifying overbought and oversold conditions. However, it’s crucial to use this setting in conjunction with other indicators and consider market factors for effective trading. Take the time to experiment and find the optimal RSI 2 setting that aligns with your trading objectives and risk tolerance.
The RSI (Relative Strength Index) is a technical indicator used in the analysis of financial markets. It is a momentum oscillator that measures the speed and change of price movements. The RSI 2 Setting is a specific parameter used when calculating the RSI.
The RSI 2 Setting refers to the number of periods over which the RSI calculation is performed. It is based on a formula that compares the average of the “up” closes to the average of the “down” closes over a certain time period. The RSI oscillates between 0 and 100, with values above 70 typically indicating an overbought condition and values below 30 suggesting an oversold condition.
The RSI 2 Setting is often used by traders and investors to identify potential reversals in price trends. It is believed that when the RSI reaches extreme levels, such as above 90 or below 10, it signifies that the market is overextended and may be due for a reversal. By using the RSI 2 Setting, traders can get a more sensitive indicator that reacts more quickly to changes in market conditions.
It is important to note that the RSI 2 Setting is just one way to use the RSI indicator. Traders may also adjust the period length and other parameters to suit their specific trading strategies. It is always recommended to use the RSI 2 Setting in conjunction with other technical analysis tools and indicators to confirm potential market reversals.
Read Also: Explore OctaFX's Legitimacy in the Philippines: A Comprehensive Review
The RSI (Relative Strength Index) is a popular technical indicator used by traders to analyze market trends and identify potential reversal points. The RSI 2 setting is a specific configuration of the RSI indicator that can be very useful for short-term trading strategies.
To use the RSI 2 setting effectively, follow these steps:
Read Also: Is Options Trading Available on Robinhood?
By following these steps and using the RSI 2 setting effectively, traders can gain valuable insights into market trends and potentially identify profitable trading opportunities.
The RSI 2 setting is a specific configuration of the Relative Strength Index (RSI) indicator, which is commonly used by traders to identify potential overbought or oversold conditions in a market.
The RSI 2 setting works by calculating the average gain and average loss over a specified period of time, typically 14 days. It then uses these calculations to determine the strength and momentum of a particular asset. When the RSI value is above 70, it indicates that the asset may be overbought and due for a price correction. Conversely, when the RSI value is below 30, it indicates that the asset may be oversold and due for a price rebound.
The RSI 2 setting has several advantages. Firstly, it provides traders with a clear signal when an asset is potentially overbought or oversold, which can be useful for making trading decisions. Additionally, the RSI 2 setting is a relatively simple and easy-to-understand indicator, making it accessible to traders of all experience levels. Lastly, the RSI 2 setting can be used in combination with other technical indicators to help confirm trading signals and increase overall accuracy.
Yes, there are a few limitations to using the RSI 2 setting. Firstly, the RSI indicator is based on historical price data, which means that it may not always accurately predict future price movements. Additionally, the RSI 2 setting is a lagging indicator, meaning that it may not provide real-time signals for entering or exiting trades. Lastly, the RSI 2 setting is most effective in trending markets, and may produce less reliable signals in ranging or choppy markets.
There are several ways to incorporate the RSI 2 setting into a trading strategy. One common approach is to use the RSI 2 indicator as a signal for entering or exiting trades. For example, a trader may buy an asset when the RSI value crosses above 30, indicating that it is oversold and potentially due for a price rebound. Conversely, a trader may sell an asset when the RSI value crosses below 70, indicating that it is overbought and potentially due for a price correction. Traders may also use the RSI 2 setting in combination with other indicators to confirm signals and increase the probability of successful trades.

The RSI 2 setting is a specific configuration for the Relative Strength Index indicator. It determines the lookback period for the calculation of the RSI value.
The RSI 2 setting works by calculating the average gains and losses over a specified lookback period, usually 2 days. It then uses these values to calculate the RSI value, which is a measure of the strength or weakness of an asset’s price.

Understanding Strangle Options Trading Strategy The strangle options trading strategy is a popular technique used by traders to profit from volatility …
Read Article
Is OctaFX Legit in the Philippines? OctaFX is a renowned online broker that has gained popularity among traders in the Philippines. As a trader, it is …
Read Article
Similar Options Strategies to Covered Calls A covered call is a popular options strategy that involves selling a call option while owning the …
Read Article
Understanding the Meaning of 5 Daily Drawdowns Daily drawdown is a term commonly used in finance to describe a decrease in an investment portfolio’s …
Read Article
Can You Get Rich with Forex Trading? Forex trading, also known as foreign exchange trading, is a popular investment opportunity that allows …
Read Article
Understanding the Impact of Dark Cloud Cover on Market Trends The Dark Cloud Cover is a popular candlestick pattern that can provide traders with …
Read Article


