

What is the most popular forex trade?
Exploring the Most Popular Forex Trade Options Forex trading is a global decentralized market where the currencies of different countries are traded. …
Read Article
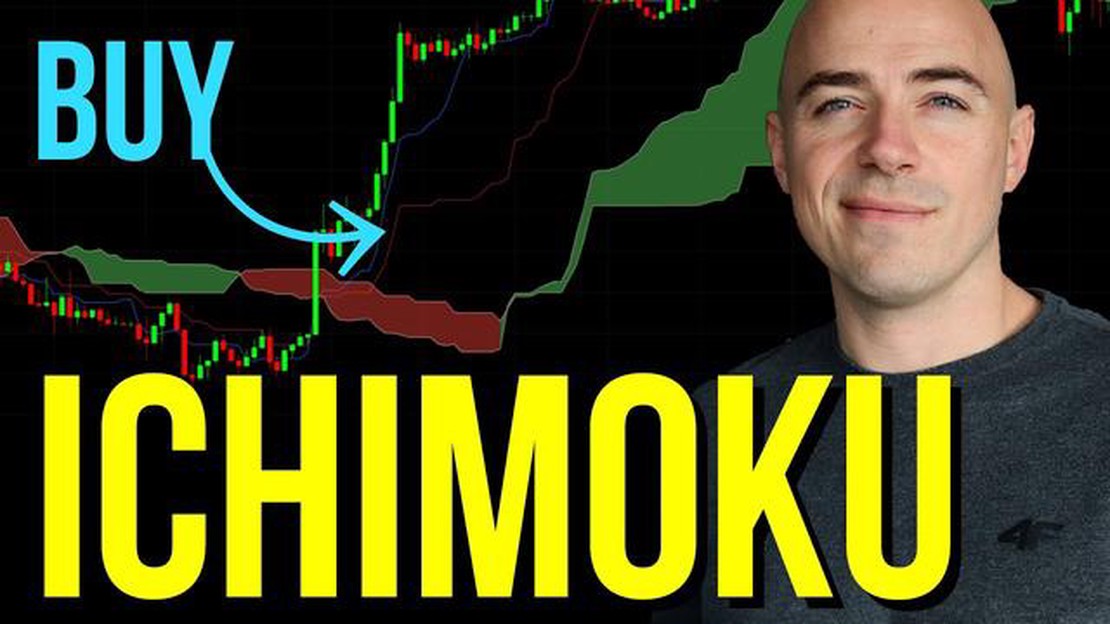
The Ichimoku Cloud is a popular technical analysis tool that is used to identify potential trend reversals and key support and resistance levels in the financial markets. It was developed by Japanese journalist Goichi Hosoda in the late 1960s and is now widely used by traders and investors around the world.
The Ichimoku Cloud consists of several components, including the Tenkan-sen, Kijun-sen, Senkou Span A, Senkou Span B, and Chikou Span. Each component provides valuable information about the current market trend and helps traders make informed decisions.
The Moving Average of the Ichimoku Cloud, also known as the Kijun-sen, is one of the key components of the Ichimoku Cloud. It is a trend-following indicator that is calculated by taking the average of the highest high and the lowest low over a certain period of time. The Kijun-sen is often used as a confirmation indicator to confirm the overall trend identified by the other components of the Ichimoku Cloud.
Traders and investors use the Moving Average of the Ichimoku Cloud to identify potential entry and exit points in the market. When the price is above the Kijun-sen, it is considered bullish, indicating that the overall trend is upward. On the other hand, when the price is below the Kijun-sen, it is considered bearish, indicating that the overall trend is downward.
The Moving Average of the Ichimoku Cloud can also be used as a support or resistance level. When the price approaches the Kijun-sen, it often acts as a support or resistance level, providing traders with an opportunity to enter or exit a trade.
In conclusion, understanding the Moving Average of the Ichimoku Cloud is essential for traders and investors who want to make informed decisions and effectively analyze the financial markets. By combining the Moving Average of the Ichimoku Cloud with the other components of the Ichimoku Cloud, traders can gain a deeper understanding of the current market trend and identify potential trading opportunities.

The moving average is a key tool in technical analysis and is widely used by traders and analysts to identify trends and potential buy or sell signals. It is a simple yet powerful indicator that can provide valuable insights into market dynamics.
Read Also: Discover the Optimal Strategies for Trading Gold in Forex - Expert Tips and Tricks
Moving averages are calculated by taking the average price of a security over a specific period of time, which is represented by a line on a price chart. The line smooths out the fluctuations in price and helps traders identify the overall direction of the market.
There are different types of moving averages, such as the simple moving average (SMA) and the exponential moving average (EMA). The SMA gives equal weight to each data point in the calculation, while the EMA gives more weight to recent data points. Traders can choose the type of moving average that best suits their trading strategy.
Understanding moving averages is important because they can help traders spot trend reversals, confirm trend strength, and provide entry and exit signals. When the price of a security is above its moving average, it is considered to be in an uptrend, signaling a potential buying opportunity. Conversely, when the price is below its moving average, it is considered to be in a downtrend, indicating a potential selling opportunity.
Moving averages can also act as support and resistance levels. When the price approaches a moving average from below and bounces off it, the moving average is acting as a support level. On the other hand, when the price approaches a moving average from above and gets rejected, the moving average is acting as a resistance level.
In conclusion, understanding moving averages is crucial for traders and analysts as they provide valuable insights into market trends, help identify potential buy or sell signals, and act as support and resistance levels. By incorporating moving averages into their trading strategy, traders can make more informed decisions and increase their chances of success in the financial markets.
The Ichimoku Cloud consists of five main components that are used to analyze market trends and identify potential trading opportunities. Understanding these components will help you make informed trading decisions and improve your overall trading strategy.
By analyzing these components of the Ichimoku Cloud, traders can gain a comprehensive view of the market and make more informed trading decisions. It is important to consider the interaction between these components and to look for confirmations before entering or exiting a trade.
The Ichimoku Cloud is a popular technical analysis tool used to identify potential trend reversals, determine support and resistance levels, and generate trading signals.
Read Also: Learn How to Add a Strategy to MyFxBook and Optimize Your Forex Trading
The Moving Average of the Ichimoku Cloud is calculated by taking the average of the nine periods of the Tenkan Sen and Kijun Sen lines. These lines are part of the Ichimoku Cloud indicator and help identify trend direction and potential reversal points.

The Moving Average of the Ichimoku Cloud can indicate trend direction and potential trend reversals. When the price is above the Moving Average, it suggests an uptrend, while a price below the Moving Average indicates a downtrend.
The Moving Average of the Ichimoku Cloud can be used in trading to identify potential entry and exit points. Traders may buy when the price crosses above the Moving Average, indicating a bullish trend, and sell when the price crosses below the Moving Average, indicating a bearish trend.
One limitation of using the Moving Average of the Ichimoku Cloud is that it may lag behind the actual price movement, especially during periods of high volatility. Traders should also consider using other indicators or analysis methods to confirm signals generated by the Moving Average of the Ichimoku Cloud.
The Moving Average of the Ichimoku Cloud is a technical indicator that is part of the Ichimoku Kinko Hyo system. It is used to identify trend direction and potential trend reversals in the market. It is calculated by taking the average of the high and low prices over a specific period of time.

Exploring the Most Popular Forex Trade Options Forex trading is a global decentralized market where the currencies of different countries are traded. …
Read Article
Do Forex Trading Robots Really Work? Forex trading robots have become increasingly popular in recent years, promising to automate the trading process …
Read Article
How much money is required to trade options? Options trading is a popular and potentially lucrative investment strategy. It allows investors to …
Read Article
Is Optiver a hedge fund? Optiver is a global market maker and high-frequency trading firm that is often associated with hedge funds due to its trading …
Read Article
Russia’s Remaining Foreign Currency Reserves Foreign currency reserves play a crucial role in a country’s economy, particularly in times of economic …
Read Article
Developing an Effective Options Trading Strategy Options trading can be a lucrative and exciting form of investment, but it requires a …
Read Article

