

Discover the Most Effective Intraday Trading Indicator in Tradingview
Identifying the Best Indicator for Intraday Trading in Tradingview When it comes to intraday trading, having the right tools and indicators can make a …
Read Article
When it comes to investing in exchange-traded funds (ETFs), understanding the moving average can be a valuable tool for investors. The moving average is a widely used technical indicator that helps investors analyze the price trend of an ETF. By calculating the average price of an ETF over a certain period of time, investors can gain insights into the overall direction of the market.
One of the main advantages of using the moving average is its simplicity. The calculation is straightforward and easy to understand. By plotting the moving average on a price chart, investors can quickly identify potential buy or sell signals. For example, when the price of an ETF crosses above the moving average, it may indicate a bullish trend and be a signal to buy. Conversely, when the price crosses below the moving average, it may indicate a bearish trend and be a signal to sell.
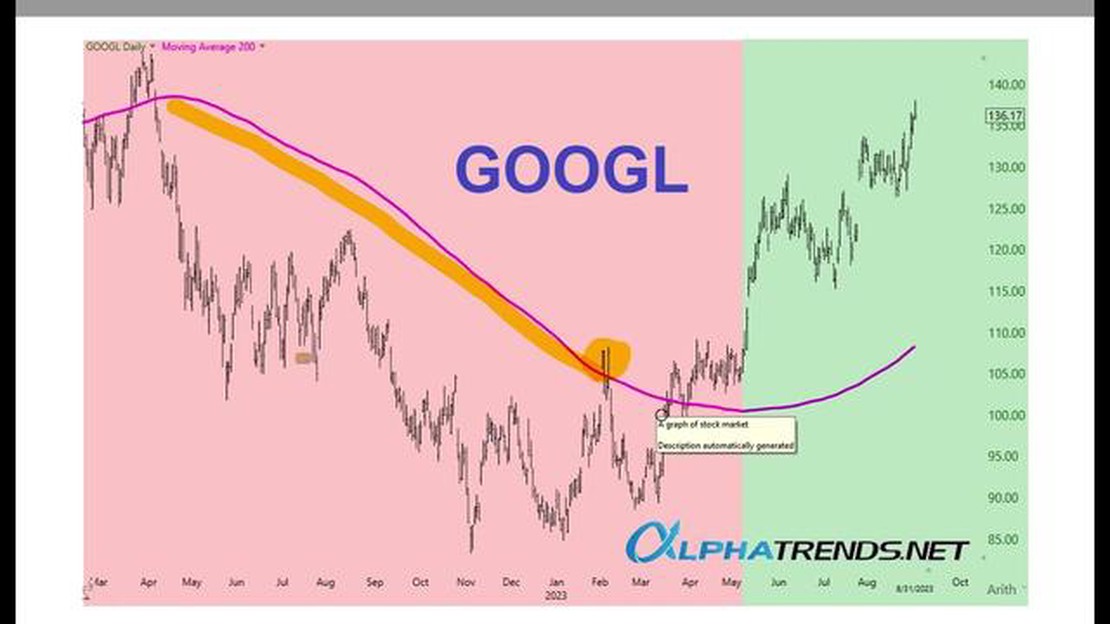
Furthermore, the moving average can also help investors filter out the noise and eliminate short-term fluctuations in price. By using longer time periods for the moving average, such as 50 or 200 days, investors can focus on the overall trend rather than getting caught up in the day-to-day market volatility. This long-term perspective can provide a more reliable signal and help investors make better-informed investment decisions.
It’s important to note that the moving average is not a foolproof indicator and should be used in conjunction with other analysis tools and indicators. It is a tool that can help investors identify potential trends and signals, but it is not a guarantee of future performance. Investors should always conduct thorough research and consider multiple factors before making investment decisions.
In conclusion, understanding the moving average of an ETF can be a valuable tool for investors. By using this technical indicator, investors can gain insights into the overall trend of an ETF and make better-informed investment decisions. While it is not a guarantee of future performance, the moving average can help filter out short-term fluctuations and provide a long-term perspective on the market. With the right analysis and careful consideration, investors can use the moving average to their advantage and enhance their investment strategies.
The Moving Average (MA) is a commonly used technical indicator in financial markets, including ETFs (Exchange Traded Funds). It calculates the average price of an ETF over a specified period of time and helps investors identify trends and potential trading opportunities.
The Moving Average is based on a mathematical formula that smooths out price fluctuations by taking an average of previous closing prices. It is typically represented by a line on a price chart and can be calculated over various time periods, such as 20 days, 50 days, or 200 days.

There are two main types of Moving Averages: the Simple Moving Average (SMA) and the Exponential Moving Average (EMA). The SMA calculates the average price over a specific period by summing up the closing prices and dividing it by the number of periods. The EMA, on the other hand, gives more weight to recent prices, making it more responsive to current market conditions.
The Moving Average can be used in different ways by investors. One common strategy is to identify the crossover of different Moving Averages. When a shorter-term Moving Average crosses above a longer-term Moving Average, it is considered a bullish signal, indicating a potential uptrend. Conversely, when a shorter-term Moving Average crosses below a longer-term Moving Average, it is seen as a bearish signal, suggesting a potential downtrend.
Another way to use the Moving Average is to determine support and resistance levels. The Moving Average line can act as a support level, providing a buying opportunity when the price of an ETF approaches it. On the other hand, the Moving Average line can act as a resistance level, signaling a selling opportunity when the price approaches it from below.
It is important to note that the Moving Average is a lagging indicator, meaning it is based on past data and may not always accurately predict future price movements. Therefore, it is often used in conjunction with other technical indicators and analysis tools to make more informed trading decisions.
Read Also: Discover the Benefits of the $30 No Deposit Bonus for Tenxprime
In conclusion, the Moving Average of an ETF is a technical indicator that helps investors identify trends, potential trading opportunities, and support/resistance levels. By understanding how to interpret and utilize the Moving Average, investors can make more informed decisions when trading ETFs.
When it comes to investing in ETFs, understanding the moving average can play a crucial role in making informed decisions. The moving average is a widely used technical indicator used by traders and investors to analyze the price trend of an ETF.
Read Also: Understanding the Role of a Voice Trader in Financial Markets
In simple terms, the moving average is a calculation that takes the average price of an ETF over a specific period of time, such as 50 days or 200 days. It provides a smoothed line that helps to filter out short-term fluctuations and reveal the underlying trend of the ETF’s price movement.
The moving average is important because it can help investors identify potential buying or selling opportunities. For example, when the price of an ETF is above its moving average, it is usually considered a bullish signal, suggesting that the trend is upward and it may be a good time to buy. On the other hand, when the price is below its moving average, it is typically seen as a bearish signal, indicating that the trend is downward and it may be a good time to sell.
Moreover, the moving average can also be used to determine support and resistance levels. These are price levels at which the ETF may encounter increased buying or selling pressure. When the price of an ETF approaches its moving average, it can act as a support level, preventing the price from falling further. Conversely, when the price moves away from its moving average, it can act as a resistance level, preventing the price from rising further.
Overall, understanding the moving average of an ETF can provide investors with valuable insights into the trend and potential future movements of the ETF’s price. By incorporating this technical indicator into their analysis, investors can make more informed decisions and potentially improve their investment returns.

A moving average is a calculation that helps investors analyze the price data of a security, such as an ETF, over a specific period of time.
The moving average is calculated by adding the closing prices of a security over a specific period of time and then dividing it by the number of periods.
Investors use the moving average to identify trends and potential buying or selling opportunities in the market.
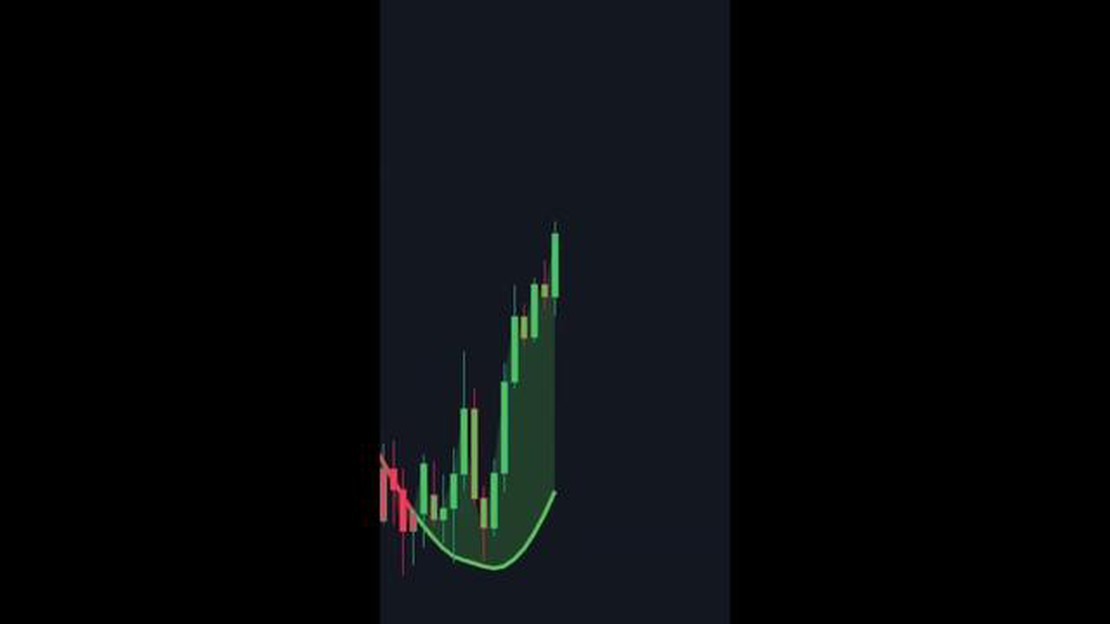
A moving average can indicate the general direction of a security’s price trend. If the moving average is trending upward, it suggests a bullish market, while a downward trending moving average suggests a bearish market.
Investors can use the moving average to determine potential entry and exit points for a security. For example, if the price of an ETF crosses above its moving average, it may be a signal to buy, and if it crosses below its moving average, it may be a signal to sell.

Identifying the Best Indicator for Intraday Trading in Tradingview When it comes to intraday trading, having the right tools and indicators can make a …
Read Article
Why is IPA famous? India Pale Ale, or IPA, is a beer style that has gained tremendous popularity in recent years. It has become a favorite among craft …
Read Article
Can you buy $500 worth of shares? Investing in stocks can be a great way to grow your wealth over time. However, many people are under the impression …
Read Article
Steps to Open an Akbank Account Are you interested in opening a bank account in Akbank? Opening a bank account can provide you with a convenient way …
Read Article
Top In-Demand Jobs in Cyprus Cyprus, a vibrant Mediterranean island, is not only known for its stunning beaches and rich historical sites, but also …
Read Article
InstaForex and MT5: What You Need to Know InstaForex is a well-known online trading platform that offers various trading options to its clients. One …
Read Article


