


Step-by-Step Guide: Installing Indicators on MT4 iOS
Step-by-step guide to installing indicators on MT4 iOS Indicators are an essential tool for traders using the MetaTrader 4 platform. They provide …
Read Article
When it comes to technical analysis in financial markets, the moving average is a widely used tool. It is a simple yet powerful indicator that helps traders and investors identify trends, spot potential reversals, and make informed trading decisions.
So, what exactly is a moving average? In simple terms, it is a calculation that takes the average price of a security over a specific period of time and plots it on a chart. The name “moving average” comes from the fact that as new prices are added to the calculation, old prices are dropped, causing the average to “move.”
The moving average is often used to smooth out price fluctuations and filter out noise, allowing traders to focus on the underlying trend. It is particularly useful in identifying support and resistance levels, as well as determining entry and exit points for trades.
Example: Let’s say you want to analyze the price of a stock over the past 50 days. You would calculate the moving average by adding up the closing prices of the stock for each of the past 50 days and dividing the sum by 50. The resulting average would represent the moving average for that particular day.
There are different types of moving averages, such as the simple moving average (SMA) and the exponential moving average (EMA). The SMA gives equal weight to every data point in the calculation, while the EMA puts more weight on recent data points, making it more responsive to price changes.

By analyzing the moving average in combination with other technical indicators, traders can gain valuable insights into market trends and make more informed trading decisions. Whether you are a beginner or an experienced trader, understanding the moving average is essential for successful trading in today’s dynamic financial markets.
A moving average is a technical analysis tool used to identify and analyze trends in financial markets. It is a calculation that smooths out price data by creating a constantly updated average price over a specific time period.
The moving average is calculated by taking the average of a predetermined number of prices over a certain period of time. For example, a 10-day moving average would be calculated by adding up the closing prices of the last 10 days and dividing it by 10. This calculation is then repeated for each subsequent day, creating a moving average that continuously updates based on the most recent data.
The main purpose of using a moving average is to filter out short-term price fluctuations and highlight the underlying trend of a security or asset. By smoothing out the price data, it becomes easier to see the overall direction of the market and identify potential buying or selling opportunities.
The two most common types of moving averages are the simple moving average (SMA) and the exponential moving average (EMA). The SMA gives equal weight to each data point in the calculation, while the EMA places more weight on the most recent data points. The choice between the two depends on the trader’s preference and the specific market conditions being analyzed.
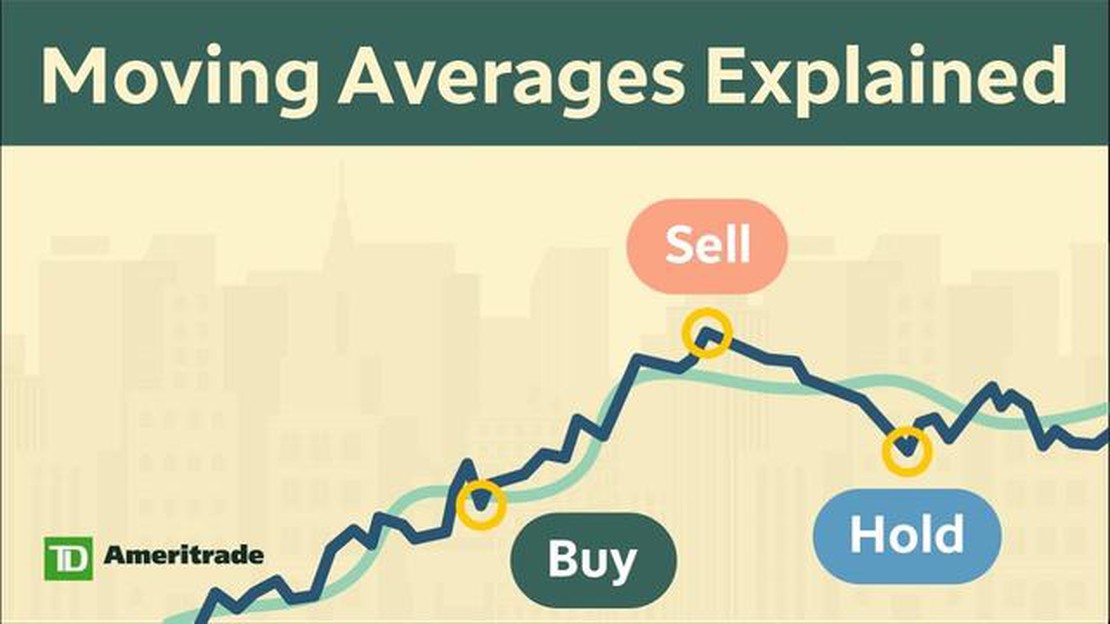
Traders and investors use moving averages in various ways. One common approach is to use a combination of short-term and long-term moving averages. When the short-term moving average crosses above the long-term moving average, it is considered a bullish signal, indicating that it may be a good time to buy. Conversely, when the short-term moving average crosses below the long-term moving average, it is seen as a bearish signal, suggesting that it may be a good time to sell.
Read Also: Learn How to Trade with Warrants and Maximize Your Profits
Moving averages can also be used as support and resistance levels. If the price of an asset is consistently bouncing off a certain moving average, it can be seen as a level of support or resistance, indicating that the price is likely to continue in the same direction.
In conclusion, a moving average is a valuable tool for analyzing market trends and identifying potential trading opportunities. It smooths out price data to reveal the underlying trend and can be used in various ways to make informed trading decisions.
Read Also: Find Out Which Bank Offers the Cheapest Exchange Rate
The Moving Average is a commonly used technical analysis tool that helps traders and investors identify trends and potential price reversals in the financial markets. It is calculated by averaging a series of data points, typically closing prices, over a specific period of time. The Moving Average smooths out price fluctuations and provides a clearer picture of the overall trend.
To calculate the Moving Average, you need to specify the time period, which can range from a few days to several months, depending on the timeframe you are analyzing. The most commonly used periods are 50-day, 100-day, and 200-day Moving Averages. The shorter the time period, the more sensitive the Moving Average is to recent price movements, while longer time periods provide a more stable and reliable trend indication.
There are two main types of Moving Averages: the Simple Moving Average (SMA) and the Exponential Moving Average (EMA). The SMA is calculated by adding up the closing prices over the specified time period and dividing it by the number of data points. The EMA, on the other hand, gives more weight to recent prices, making it more responsive to current market conditions.
The Moving Average can be used in various ways to analyze price trends and generate trading signals. When the price is above the Moving Average, it is considered a bullish signal, indicating an uptrend. Conversely, when the price falls below the Moving Average, it is seen as a bearish signal, suggesting a downtrend. Traders also look for crossovers between two Moving Averages of different time periods to confirm trend reversals or entry/exit points.
It is important to note that the Moving Average is not a predictive indicator, but rather a lagging one that reflects past price data. Therefore, it is crucial to use other technical tools and indicators in conjunction with the Moving Average to increase the accuracy of trading decisions.
A moving average is a commonly used statistical calculation that is used to analyze data points over a certain period of time. It helps to smooth out fluctuations and highlight trends.

A moving average is calculated by taking the average of a set of data points over a specific period of time. For example, if you are using a 10-day moving average, you would add up the closing prices of the 10 most recent days and divide it by 10.
The purpose of using a moving average is to identify trends and reduce noise in a data set. It helps to smooth out random fluctuations in the data and provides a clearer picture of the overall direction of the data over time.
There are three common types of moving averages: simple moving average (SMA), exponential moving average (EMA), and weighted moving average (WMA). SMA gives equal weight to each data point, EMA gives more weight to recent data points, and WMA gives more weight to certain data points based on a specified criteria.

Step-by-step guide to installing indicators on MT4 iOS Indicators are an essential tool for traders using the MetaTrader 4 platform. They provide …
Read Article
Reasons to Buy in Forex: Exploring the Advantages Forex trading, also known as foreign exchange trading, is the buying and selling of currencies on …
Read Article
When is the Best Time to Cash In Stock Options? Stock options are a popular form of compensation for employees, giving them the opportunity to …
Read Article
Understanding Covariance Matrix Values Covariance matrix is a fundamental tool in statistics and data analysis. It provides valuable information about …
Read Article
Trading Earnings Season with Options: Strategies and Tips Earnings season is a crucial time for investors and traders alike. It is during this time …
Read Article
The Origin of Forex Trading in South Africa Forex trading, or the foreign exchange market, has a long and fascinating history in South Africa. The …
Read Article


