

Which indicator is the most effective for ADX? Discover the top options.
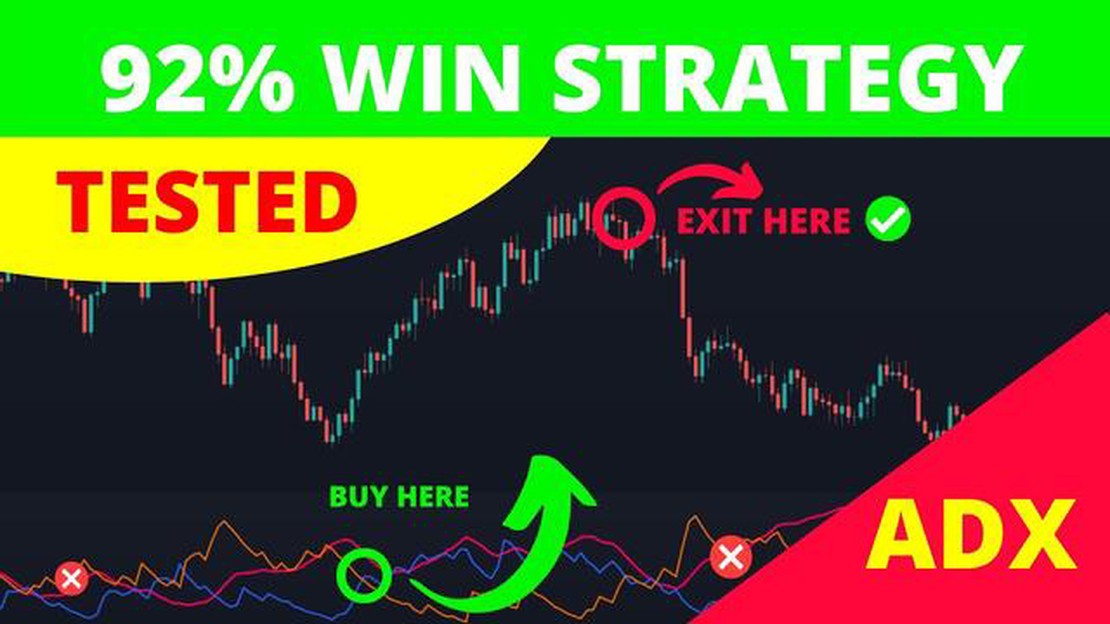
What is the best indicator for ADX? When it comes to trading in the financial market, having a reliable indicator is crucial. The Average Directional …
Read Article

Technical analysis is a popular approach used by traders and investors to forecast future price movements in financial markets. One of the key components of technical analysis is the interpretation of candlestick charts. These charts display the price action for a given time period and provide valuable insights into market sentiment.
Bullish candles are an essential part of understanding market trends and making informed trading decisions. A bullish candle represents a period of time in which the price of an asset has increased. It is characterized by a long body and a short wick, indicating strong buying pressure.
When three consecutive bullish candles appear on a chart, it is known as a three bullish candles pattern. This pattern is considered a strong signal of bullish market sentiment and often indicates a potential uptrend. Traders look for this pattern to confirm their analysis and make decisions to enter or exit trades.
It is important to note that interpreting candlestick patterns alone is not enough for making accurate predictions. Traders should use other technical indicators and confirmatory signals to validate their analysis. However, understanding the meaning of three bullish candles can be a powerful tool in identifying potential profitable trading opportunities.
Technical analysis is a method used by traders and investors to analyze financial markets and make trading decisions based on historical price data and statistical indicators. It involves studying price patterns, trends, and other market data to identify potential future price movements and trends.
Technical analysts believe that all relevant information about a particular asset or market is already reflected in its price and volume data. By analyzing these patterns and trends, they aim to predict future price movements and take advantage of potential profit opportunities.
Technical analysis relies on the assumption that market prices follow consistent patterns and trends that can be identified and used to make informed trading decisions. It differs from fundamental analysis, which focuses on analyzing the financial health and performance of a company or asset.
Traders who use technical analysis often employ a variety of tools and techniques, including chart patterns, trend lines, moving averages, and oscillators. These tools help them visualize and interpret market data in order to identify potential entry and exit points for trades.

One of the key principles of technical analysis is that history tends to repeat itself. Therefore, by studying past price movements and market behavior, traders can gain insights into how prices are likely to behave in the future.
While technical analysis is not without its critics and limitations, many traders and investors find it to be a valuable tool for making informed trading decisions. By understanding the meaning of different chart patterns and indicators, traders can enhance their ability to identify potential bullish or bearish market trends and take advantage of profitable trading opportunities.
Read Also: Understanding Global FX Trading: A Comprehensive Guide
Technical analysis is a popular method used by traders and investors to forecast future price movements in the financial markets. It is based on the belief that historical price data, such as charts and patterns, can be used to predict future price actions.
Technical analysts study price patterns, volume, and other market data to identify trends and make predictions about the future direction of prices. They use various tools and techniques, including chart patterns, indicators, oscillators, and trend lines, to analyze and interpret market data.
One of the key principles of technical analysis is that market prices reflect all available information, including fundamental factors, market sentiment, and investor psychology. Technical analysts believe that by studying price patterns and trends, they can gain insight into market behavior and make informed trading decisions.
Technical analysis is widely used in various financial markets, including stocks, bonds, commodities, and currencies. It is used by both short-term traders looking to profit from short-term price movements and long-term investors looking to identify potential entry and exit points.
While technical analysis is not without its critics, many traders and investors find it to be a valuable tool in their decision-making process. It allows them to identify potential opportunities and manage risk by analyzing and interpreting market data.
Overall, technical analysis is a dynamic and evolving field that continues to grow in popularity. As technology advances and more data becomes available, new tools and techniques are being developed to improve the accuracy and effectiveness of technical analysis.
In technical analysis, bullish candles are an important tool for traders to understand market trends and make informed investment decisions. A bullish candle is a candlestick pattern that suggests a potential upward movement in price. It is characterized by a long real body, which represents the price range between the opening and closing prices of a given period (such as a day or a week).
There are several types of bullish candles, each with its own significance in analyzing market trends. One common type is the bullish engulfing pattern, which occurs when a small bearish candle is followed by a larger bullish candle that completely engulfs it. This pattern indicates a potential trend reversal and suggests that buyers are gaining control over sellers.
Read Also: Understanding the Discrepancy: Why Is My Equity Bigger Than My Balance?
Another type is the hammer candle, which has a small real body and a long lower shadow. This pattern typically forms at the end of a downtrend and suggests that buyers are stepping in to push the price higher. The hammer candle is often considered a bullish signal.
Additionally, the morning star pattern is another bullish candle formation. It consists of three candles: a long bearish candle, followed by a small indecisive candle, and then a larger bullish candle that closes above the midpoint of the first candle. This pattern indicates a potential reversal from a downtrend to an uptrend, and is considered a strong bullish signal.

Traders use bullish candles in technical analysis to identify potential buying opportunities and confirm bullish trends. They often combine bullish candle patterns with other technical indicators and chart patterns to increase the accuracy of their predictions.
It is important to note that while bullish candles suggest a potential upward movement, they are not always a guarantee of future price increases. Traders should always consider other factors such as volume, market sentiment, and overall market conditions before making any investment decisions based solely on bullish candles.
In conclusion, understanding the meaning of bullish candles in technical analysis can help traders identify potential buying opportunities and confirm bullish trends. By combining these patterns with other technical indicators, traders can make more informed investment decisions.
Bullish candles in technical analysis are candlestick patterns that indicate a potential upward trend in the price of an asset. They are characterized by their long bodies and small or nonexistent shadows.
To identify bullish candles on a price chart, look for candles with long bodies and little to no shadows. The color of the candle depends on the specific charting software, but traditionally, green or white candles are used to represent bullish candles.
When there are three bullish candles in a row, it indicates a strong upward momentum in the price of the asset. This pattern is often referred to as a “three white soldiers” pattern and is considered a bullish continuation signal.
Three bullish candles can be a reliable signal for buying, especially when they occur after a period of consolidation or a downtrend. However, it is important to consider other technical indicators and confirm the trend before making any trading decisions.

What is the best indicator for ADX? When it comes to trading in the financial market, having a reliable indicator is crucial. The Average Directional …
Read Article
Free Historical Stock Data: Where to Find It When it comes to making informed investment decisions, having access to reliable historical stock data is …
Read Article
Is scalp trading illegal? Scalp trading, also known as scalp trading or scalping, is a popular trading strategy where traders make multiple short-term …
Read Article
Is Forex Trading in Nigeria Profitable? Forex trading has become increasingly popular in Nigeria, as more and more individuals are realizing the …
Read Article
Why options prices change overnight Options prices can be extremely volatile, often changing dramatically overnight. This can leave traders and …
Read Article
Discover the Benefits of Option Trading Option trading is a popular investment strategy that offers several advantages for investors looking to …
Read Article


