


How to Properly Report the Exercise of Stock Options: A Complete Guide
Reporting the Exercise of Stock Options Stock options can be a valuable form of compensation for employees, giving them the opportunity to purchase …
Read Article
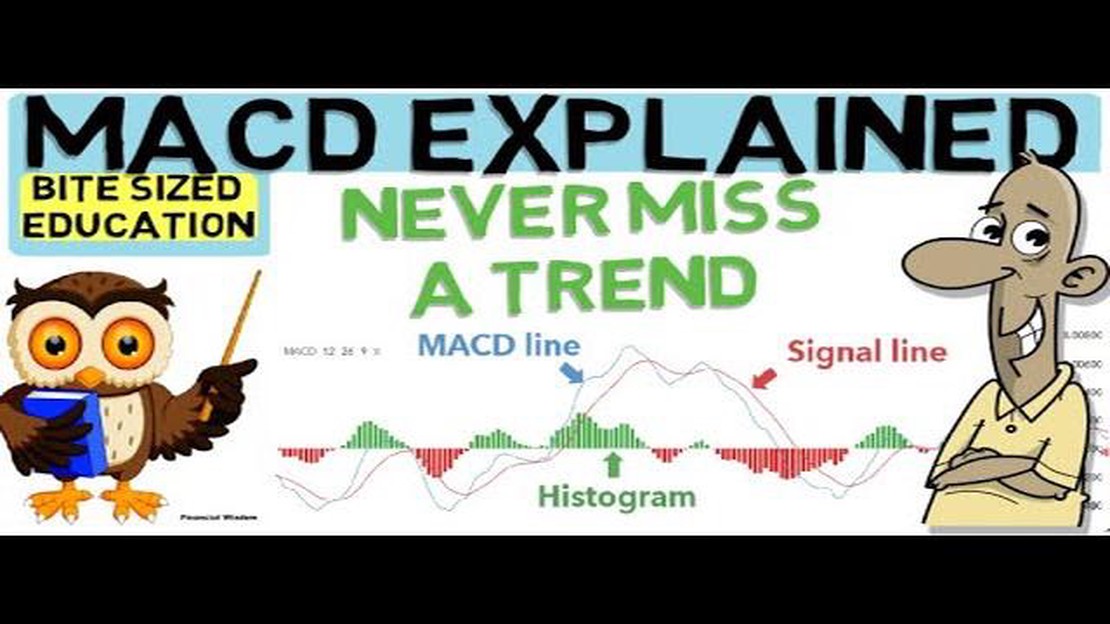
The Moving Average Convergence Divergence (MACD) indicator is a popular technical analysis tool used by traders to identify potential buy and sell signals in financial markets. It is a versatile indicator that combines trend-following and momentum elements, providing traders with valuable insights into market trends and possible reversals.
The MACD indicator consists of two lines: the MACD line and the signal line. The MACD line is calculated by subtracting the 26-day Exponential Moving Average (EMA) from the 12-day EMA, while the signal line is a 9-day EMA of the MACD line. The MACD line crossing above the signal line is considered a bullish signal, indicating a potential buying opportunity, while the opposite crossing is seen as a bearish signal, signaling a potential selling opportunity.
In addition to the MACD line and signal line, the MACD indicator also includes a histogram, which represents the difference between the MACD line and the signal line. Positive histogram bars indicate bullish momentum, while negative bars suggest bearish momentum. Traders often look for divergences between price action and the MACD histogram to identify potential trend reversals.
While the MACD indicator is widely used by traders, it is important to understand its limitations and potential pitfalls. Like any technical indicator, the MACD is not infallible and should be used in conjunction with other forms of analysis. Additionally, false signals can occur, especially in choppy or sideways markets. Therefore, it is crucial for traders to use the MACD indicator in combination with other technical analysis tools and to carefully evaluate the overall market context before making trading decisions.
The MACD (Moving Average Convergence Divergence) is a popular technical analysis indicator that is used to identify potential trade opportunities in the financial markets.
The MACD indicator consists of two lines: the MACD line and the signal line. The MACD line is calculated by subtracting the 26-day exponential moving average (EMA) from the 12-day EMA. The signal line, also known as the trigger line, is a 9-day EMA of the MACD line.
The MACD line represents the difference between the short-term and long-term price trends, while the signal line helps to confirm the strength of the trend. When the MACD line crosses above the signal line, it is considered a bullish signal, indicating that it may be a good time to buy. Conversely, when the MACD line crosses below the signal line, it is considered a bearish signal, indicating that it may be a good time to sell.

In addition to the MACD line and the signal line, the MACD indicator also includes a histogram, which is a bar chart that measures the distance between the MACD line and the signal line. The histogram can be used to visualize the strength of the trend. When the histogram is positive, it indicates a bullish trend, and when it is negative, it indicates a bearish trend.
The MACD indicator is versatile and can be applied to various timeframes and financial instruments. It is commonly used in conjunction with other technical analysis tools and indicators to confirm trade signals and improve accuracy.
Read Also: Reasons executives are given stock options and their benefits
Overall, the MACD indicator is a valuable tool for traders and investors who want to identify potential trade opportunities and make informed decisions in the financial markets.
The MACD (Moving Average Convergence Divergence) indicator is a popular technical analysis tool used by traders to identify potential buy and sell signals in the financial markets. It is comprised of three components: a MACD line, a signal line, and a histogram.
The MACD line is calculated by subtracting the 26-day exponential moving average (EMA) from the 12-day EMA. The resulting line plots the difference between these two moving averages on a chart, showing the momentum of the asset’s price movement.
The signal line is a 9-day EMA of the MACD line. It is used to generate entry and exit signals for traders. When the MACD line crosses above the signal line, it is considered a bullish signal and suggests that it may be a good time to buy the asset. Conversely, when the MACD line crosses below the signal line, it is a bearish signal indicating that it may be time to sell.
The histogram is a visual representation of the difference between the MACD line and the signal line. It helps traders to quickly identify the strength of the current trend. When the histogram is positive, it indicates bullish momentum, while a negative histogram suggests bearish momentum.
| MACD Line | Signal Line | Histogram |
|---|---|---|
| The difference between the 12-day EMA and the 26-day EMA. | A 9-day EMA of the MACD line. | The bar chart representation of the difference between the MACD line and the signal line. |
| Helps identify the momentum of the asset’s price movement. | Generates entry and exit signals. | Indicates the strength of the current trend. |
Traders often use the MACD indicator in conjunction with other technical analysis tools to confirm potential trading opportunities. It is important to note that the MACD indicator is not infallible and should be used as part of a comprehensive trading strategy.
By understanding the basics of the MACD indicator, traders can gain valuable insights into the momentum and direction of an asset’s price movement, and make more informed trading decisions.
Read Also: What is soft FX? Unraveling the Secrets of Soft FX Trading
The MACD (Moving Average Convergence Divergence) indicator is a popular technical analysis tool used by traders to identify potential trend reversals, generate buy or sell signals, and gauge the strength of a trend.
The MACD indicator is calculated by subtracting the 26-day exponential moving average (EMA) from the 12-day EMA. A 9-day EMA of the MACD line is then plotted to generate the signal line. The MACD histogram represents the difference between the MACD line and the signal line.

The MACD line is used to identify potential trend reversals. When the MACD line crosses above the signal line, it is considered a bullish signal, indicating that it may be a good time to buy. Conversely, when the MACD line crosses below the signal line, it is a bearish signal, indicating that it may be a good time to sell.
The MACD histogram is used by traders to measure the strength of a trend. When the histogram bars are increasing in size, it suggests that the trend is gaining momentum. On the other hand, decreasing histogram bars indicate that the trend may be losing strength and could potentially reverse.
Yes, the MACD indicator can be used for all types of assets, including stocks, commodities, currencies, and cryptocurrencies. It is a versatile tool that can help traders identify potential trading opportunities across different markets.
MACD stands for Moving Average Convergence Divergence. It is a popular technical indicator used by traders to identify potential buying and selling opportunities in a security.
MACD is calculated using two exponential moving averages (EMA) of different lengths. The indicator consists of two lines - the MACD line and the signal line. When the MACD line crosses above the signal line, it generates a bullish signal, indicating a potential buying opportunity. Conversely, when the MACD line crosses below the signal line, it generates a bearish signal, indicating a potential selling opportunity.

Reporting the Exercise of Stock Options Stock options can be a valuable form of compensation for employees, giving them the opportunity to purchase …
Read Article
How much money do you need to start day trading options? Day trading options can be an exciting and potentially lucrative venture, but it’s important …
Read Article
Best Place to Transfer Currency When it comes to transferring currency, finding the best place to do so can save you time and money. Whether you need …
Read Article
Valuation of American Options In the world of finance, American options are a type of financial derivative that give the holder the right, but not the …
Read Article
Trading in a Tablet: Is it Possible?+ With the ever-increasing popularity of tablets, many traders are wondering if it is possible to trade on the go. …
Read Article
Malaysia’s Foreign Reserves: A Closer Look at the Numbers Foreign reserves play a crucial role in the economic stability of a country, and Malaysia is …
Read Article


