


What is the Right Amount of Risk for Binary Options Trading?
How much to risk in binary options? Binary options trading is a popular form of investment that allows individuals to potentially earn high returns on …
Read Article
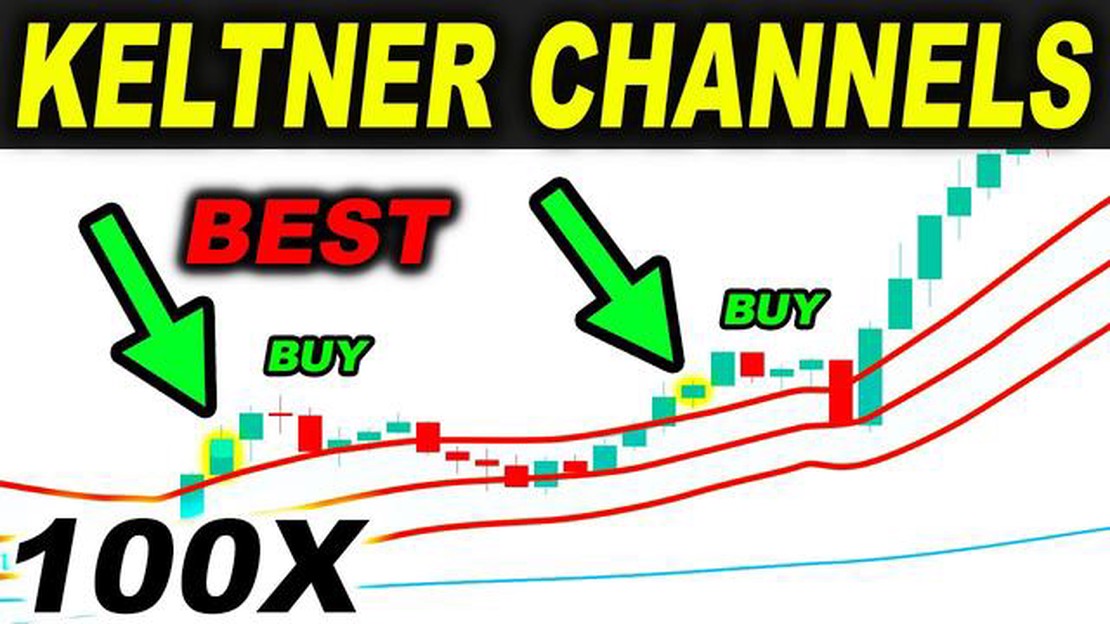
The Keltner Channel is a popular technical analysis tool used by traders to identify potential breakouts and trends in the financial markets. Developed by Chester W. Keltner, the indicator consists of a central moving average line, as well as two lines plotted above and below the moving average. These outer lines are calculated by adding and subtracting a multiple of the average true range (ATR) from the moving average.
One of the key considerations when using the Keltner Channel indicator is determining whether it is leading or lagging. A leading indicator provides signals in advance of a potential trend reversal or breakout, while a lagging indicator confirms a trend after it has already started. The nature of the Keltner Channel depends on the period setting used for the moving average and the multiplier applied to the ATR.
Generally, a shorter period and a higher ATR multiplier will result in a more leading Keltner Channel indicator. This means that it may provide signals ahead of trend reversals or breakouts, allowing traders to potentially enter positions at more favorable prices. On the other hand, a longer period and a lower ATR multiplier will lead to a more lagging Keltner Channel, providing signals later in a trend or breakout.
It is important for traders to understand the leading or lagging nature of the Keltner Channel indicator in order to effectively use it in their trading strategies. By considering the period setting and the ATR multiplier, traders can adjust the indicator to match their desired level of leading or lagging signals. Additionally, it is crucial to combine the Keltner Channel with other technical analysis tools and indicators to confirm signals and increase the overall accuracy of trading decisions.
In conclusion, the Keltner Channel indicator is a versatile tool that can be adapted to suit different trading strategies. Understanding its leading or lagging nature is essential for effectively utilizing it in predicting potential trend reversals and breakouts. By combining it with other technical indicators and applying sound risk management principles, traders can increase their chances of making profitable trading decisions.
The Keltner Channel indicator is a technical analysis tool that is widely used by traders to identify potential breakouts and trend reversals in the financial markets. It consists of three lines that are plotted around a simple moving average (SMA) of the price. The upper and lower lines represent the upper and lower bands of the channel, while the middle line is the SMA.

One of the key features of the Keltner Channel indicator is its leading nature. Unlike other indicators that lag behind the price action, the Keltner Channel has the ability to anticipate trend changes and provide early signals to traders. This makes it a valuable tool for traders who want to stay ahead of the market and take advantage of profitable trading opportunities.
The leading nature of the Keltner Channel indicator is primarily due to its calculation methodology. The upper and lower bands are calculated using the Average True Range (ATR), which measures the volatility of the price. As the ATR captures the current level of volatility, the Keltner Channel adjusts dynamically to changing market conditions. This allows it to adapt quickly to price movements and provide early signals of potential trend changes.
Another reason why the Keltner Channel indicator is leading in nature is its ability to identify overbought and oversold conditions in the market. The upper and lower bands serve as dynamic support and resistance levels. When the price moves close to the upper band, it is considered overbought, and a potential reversal or pullback may occur. Conversely, when the price moves close to the lower band, it is considered oversold, and a potential bounce or reversal may happen.
Read Also: What is Hybrid Trade? Understanding the Concept and Benefits
Traders can use the leading signals generated by the Keltner Channel indicator to place trades in the direction of the emerging trend. For example, if the price breaks above the upper band, it could signal the start of an uptrend, and traders can enter long positions. Conversely, if the price breaks below the lower band, it could indicate the start of a downtrend, and traders can enter short positions.
In conclusion, the Keltner Channel indicator is a powerful tool that offers leading signals to traders. Its ability to anticipate trend changes and identify overbought/oversold conditions provides valuable insights into the market. By understanding and utilizing the leading nature of this indicator, traders can improve their trading decisions and increase their chances of profitability.
A leading indicator is a type of technical indicator that is used to forecast future price movements in a financial market. It provides traders with insights into potential changes in market trends and helps them make informed trading decisions.
Unlike lagging indicators, which provide signals after a trend has already been established, leading indicators attempt to predict changes in price direction before they occur. These indicators are based on mathematical calculations and historical data, and they are designed to identify potential turning points in the market.
Leading indicators are often used by traders who employ a proactive trading strategy, as they aim to capture trends early and take advantage of potential profit opportunities. They are especially popular among day traders and short-term traders who seek to make quick profits from short-term price movements.
There are various types of leading indicators, each with its own unique calculation method and interpretation. Some common examples include stochastic oscillator, relative strength index (RSI), and moving averages.
Read Also: Understanding the Importance of OTA Strategy in the Hospitality Industry
It is important to note that while leading indicators can provide valuable insights into potential market movements, they are not foolproof. They are based on historical data and mathematical calculations, which means that they can sometimes generate false signals. Therefore, it is crucial for traders to use leading indicators in conjunction with other tools and analysis techniques to confirm their trading decisions.
In conclusion, leading indicators play a crucial role in technical analysis and can help traders predict future price movements. By identifying potential changes in market trends early on, traders can position themselves to take advantage of profit opportunities. However, it is important to use leading indicators cautiously and validate their signals with other forms of analysis.
The Keltner Channel Indicator is a technical analysis tool that is used to identify potential market trends and to determine whether a market is overbought or oversold.

The Keltner Channel Indicator works by plotting two lines above and below a moving average of a security’s price. These lines, also known as the upper and lower bands, are calculated based on a multiplier of the Average True Range (ATR) of the security. Traders use the position of the price relative to the bands to determine potential buy or sell signals.
The Keltner Channel Indicator is considered to be a leading indicator. It provides signals before a trend has fully formed, allowing traders to potentially enter positions early and capture larger profits. However, like all technical indicators, it is not foolproof and should be used in conjunction with other analysis tools.
Yes, the Keltner Channel Indicator can be applied to different timeframes, such as intraday, daily, weekly, or monthly charts. The timeframe used will determine the length of the moving average and the multiplier for the Average True Range. Traders should choose a timeframe that aligns with their trading strategy and goals.
The Keltner Channel Indicator can be used in various ways in a trading strategy. One common approach is to wait for the price to touch or break through the upper or lower band, which can be a signal to enter a trade. Traders may also look for the price to bounce off the bands or for the bands to squeeze together, indicating a potential breakout or trend reversal. It’s important to combine the Keltner Channel Indicator with other analysis tools and risk management techniques to increase the likelihood of successful trades.
The Keltner Channel Indicator is a technical analysis tool that is used to determine overbought or oversold conditions in the market. It consists of an upper and lower band based on an average true range, with a middle line that can be used as a trend indicator.

How much to risk in binary options? Binary options trading is a popular form of investment that allows individuals to potentially earn high returns on …
Read Article
Is Myfxbook safe to use? When it comes to online trading, security is of utmost importance. Traders need to have the assurance that their personal and …
Read Article
Is Security Bank same as Security Bank and Trust Company? When it comes to the world of banking, names can often be confusing. People sometimes wonder …
Read Article
Is it possible to make a living scalping forex? Forex trading is a highly competitive and volatile market, where traders aim to profit by taking …
Read Article
Is IBKR good for options? When it comes to options trading, the choice of broker can make a significant impact on your overall trading experience. One …
Read Article
What is the appropriate tipping etiquette in Egypt? Egypt, known for its rich history and vibrant culture, is a popular travel destination for …
Read Article


