


Master Efficient Coding: Tips and Strategies to Learn Code Efficiency
Mastering Code Efficiency: How to Learn and Improve Efficient coding is a fundamental skill for any aspiring programmer or software developer. Being …
Read Article
If you are an investor or trader, chances are you have come across the term “Bollinger Bands” in your research. Bollinger Bands are a popular technical analysis tool used to measure volatility and identify potential price reversals in financial markets.
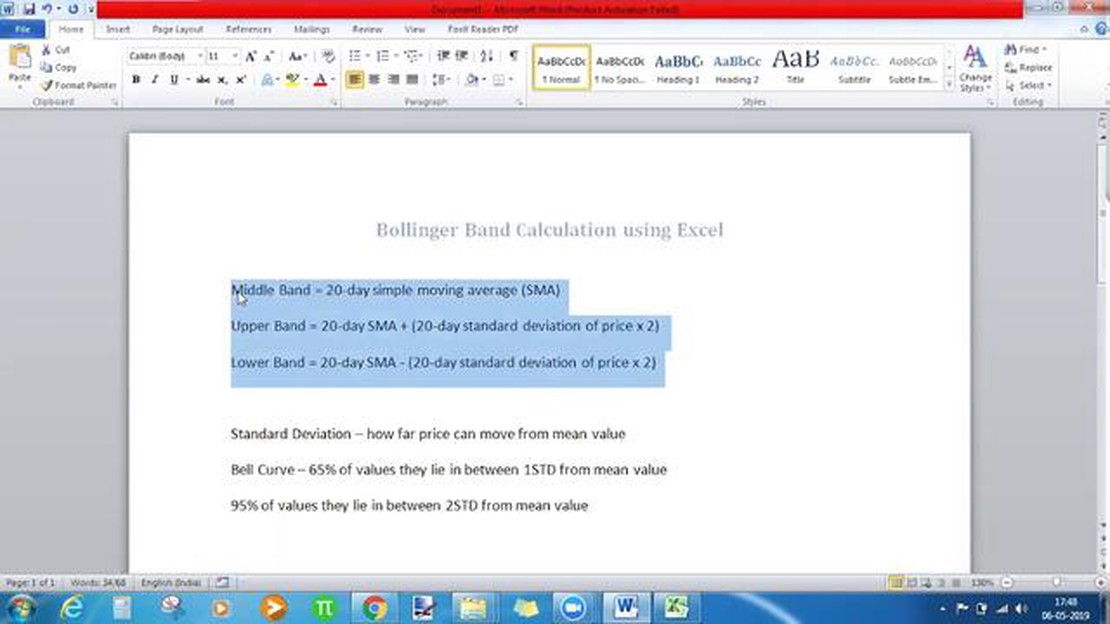
Developed by John Bollinger in the 1980s, Bollinger Bands consist of a simple moving average (SMA) in the middle, with an upper band (SMA + 2 standard deviations) and a lower band (SMA - 2 standard deviations) plotted above and below it, respectively.
The formula for calculating Bollinger Bands involves several key components. First, the period length defines the number of data points used in the calculations. The most commonly used period length is 20, but it can be adjusted according to the timeframe and trading strategy.
To calculate the SMA, you need to sum the closing prices of the selected period and divide the total by the period length. This moving average serves as the baseline for the upper and lower bands.
The standard deviation is the statistical measure of volatility. It shows how much the closing prices deviate from the moving average. To calculate the standard deviation, you need to subtract the moving average from each closing price, square the differences, sum them up, divide by the period length, and take the square root of the result.
In summary, Bollinger Bands provide valuable insights into market volatility and potential price reversals. Understanding the formula behind Bollinger Bands allows traders and investors to interpret and utilize this powerful tool effectively. By combining Bollinger Bands with other technical indicators and analysis techniques, market participants can make more informed decisions in their trading and investment strategies.
Bollinger Bands are a popular technical analysis tool that traders use to help identify potential price reversals and market trends. Created by John Bollinger in the 1980s, these bands are based on a statistical formula that utilizes standard deviation to measure price volatility.
The main components of Bollinger Bands are the upper band, the middle band, and the lower band. The middle band is typically a simple moving average (SMA) of the security’s price over a certain period, such as 20 days. The upper and lower bands are calculated by adding and subtracting a certain number of standard deviations from the middle band.
The standard deviation is a measure of how much the price of a security varies from its average price. By adding and subtracting a certain number of standard deviations from the middle band, Bollinger Bands expand and contract based on market volatility. When the market is more volatile, the bands widen, and when the market is less volatile, the bands contract.
When the price of a security touches or moves outside the upper band, it may indicate that the security is overbought, and a price reversal or pullback could occur. On the other hand, when the price touches or moves outside the lower band, it may suggest that the security is oversold, and a price reversal or bounce could happen.

Traders often use Bollinger Bands in combination with other technical indicators to confirm signals and identify potential buying or selling opportunities. By understanding the basics of Bollinger Bands and how they are calculated, traders can gain valuable insights into market volatility and potential price reversals.
Bollinger Bands are a technical analysis tool that was developed by John Bollinger in the 1980s. They are used to analyze the volatility and price levels of a security or asset. Bollinger Bands consist of a middle band and two outer bands, which are placed above and below the middle band.
The middle band is typically a simple moving average (SMA) of the security’s closing prices over a specified period of time. The outer bands are calculated by adding and subtracting a multiple of the standard deviation of the security’s closing prices from the middle band. The standard deviation is a measure of the volatility of the security.
Bollinger Bands provide a visual representation of the price levels that a security typically trades within. When a security’s price is near the upper band, it is considered to be overbought, and when it is near the lower band, it is considered to be oversold. Traders and investors use Bollinger Bands to identify potential buying and selling opportunities based on these overbought and oversold conditions.
In addition to price levels, Bollinger Bands can also be used to signal potential trend reversals. When the price of a security breaks through the upper band, it may indicate that the uptrend is weakening, and when it breaks through the lower band, it may indicate that the downtrend is weakening. These breakouts can be used as signals to enter or exit a trade.
Read Also: Discover the Truth: Are Forex Signals Real or Just a Scam?
Overall, Bollinger Bands are a versatile tool that can be used to analyze the volatility and price levels of a variety of securities and assets. They provide valuable information to traders and investors and can help them make more informed trading decisions.
The Bollinger Bands indicator consists of a simple moving average (SMA) and two standard deviation channels. The calculation of Bollinger Bands involves several steps:
Read Also: Can I Fund My Forex Account with a Credit Card? Discover the Options
Step 1: Calculate the Simple Moving Average (SMA) of the closing prices over a certain period. The most commonly used period is 20 days.
Step 2: Calculate the standard deviation (SD) of the closing prices over the same period as the SMA. This measures the volatility of the price data.
Step 3: Calculate the upper band by adding two standard deviations to the SMA. The upper band represents the highest expected price based on the volatility of the data.
Step 4: Calculate the lower band by subtracting two standard deviations from the SMA. The lower band represents the lowest expected price based on the volatility of the data.
Step 5: Plot the SMA, upper band, and lower band on a chart to visualize the Bollinger Bands.

For example, if the SMA is calculated as $100 and the standard deviation is calculated as $5, the upper band would be $110 and the lower band would be $90.
Bollinger Bands are often used in technical analysis to identify periods of high or low volatility and to determine overbought or oversold conditions. Traders may also look for price breakouts when the price moves outside of the bands.
It’s important to note that Bollinger Bands are a lagging indicator, meaning they provide signals after the price has already moved. Therefore, they are best used in conjunction with other technical analysis tools to confirm trading signals.
Bollinger Bands are a technical analysis tool that consists of two standard deviation lines plotted above and below a simple moving average. They are used to measure volatility and identify potential trend reversals.
Bollinger Bands are calculated by first plotting a simple moving average (SMA). Then, two standard deviation lines are plotted above and below the SMA. The standard deviation is calculated based on the closing prices of the asset being analyzed.
When the price touches the upper Bollinger Band, it may indicate that the asset is overbought and due for a downward correction. Traders often use this as a signal to sell or take profits.
Bollinger Bands can be used to identify potential trend reversals when the price consistently touches the outer bands. If the price is consistently touching the upper band and then starts to touch the lower band, it may suggest that the trend is reversing from an uptrend to a downtrend.
Bollinger Bands can be effective for a wide range of assets, including stocks, currencies, and commodities. However, their effectiveness may vary depending on the specific characteristics of the asset being analyzed.

Mastering Code Efficiency: How to Learn and Improve Efficient coding is a fundamental skill for any aspiring programmer or software developer. Being …
Read Article
Understanding Algorithmic Trading in MiFID II Algorithmic trading has become an increasingly popular method of executing financial transactions. With …
Read Article
Introducing the New Activity in Diablo 3: Exploring the Game’s Latest Addition Attention all Diablo 3 fans! Brace yourselves for the latest and …
Read Article
What is Forex Fury? When it comes to trading in the forex market, having a reliable and profitable expert advisor can make all the difference. One …
Read Article
Trading Index Futures and Options: A Comprehensive Guide Index futures and options are a popular choice among traders looking to diversify their …
Read Article
Understanding the Mechanics of a Message Board Welcome to our comprehensive guide on message boards! Whether you are new to the world of online …
Read Article


