

Understanding Blue Sky Laws for ETF: Everything You Need to Know
What are the blue sky laws for ETF? The world of investing can be complex and overwhelming, especially when it comes to Exchange-Traded Funds (ETFs). …
Read Article
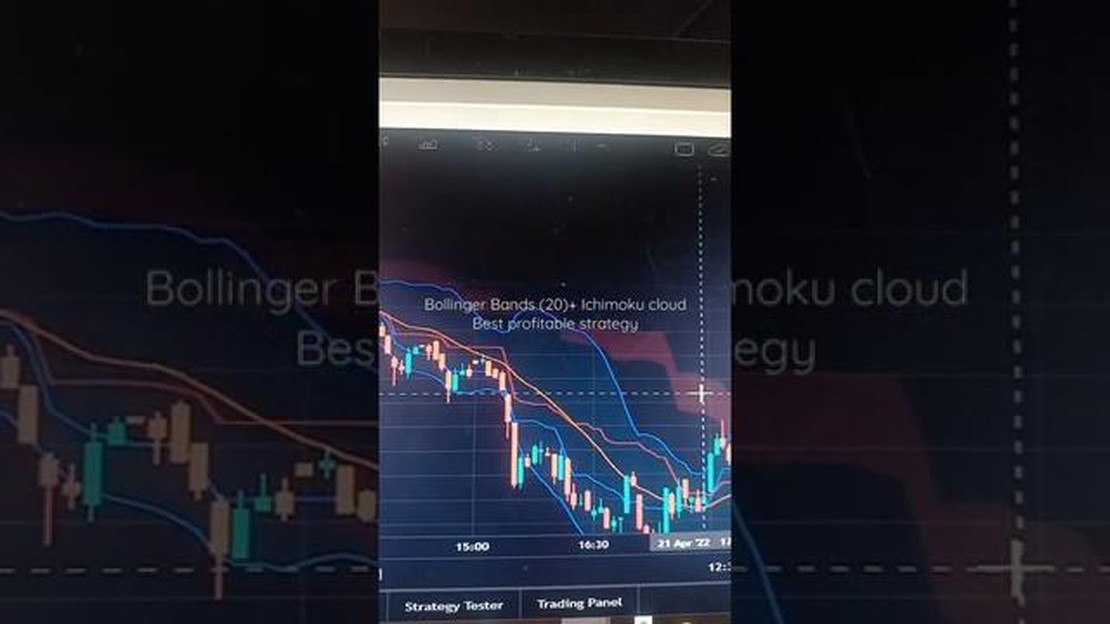
When it comes to trading strategies, two popular technical indicators that are often used by traders around the world are the Bollinger Bands and the Ichimoku Cloud. Understanding how to properly utilize these indicators can significantly enhance your trading decisions and potentially lead to increased profits.
The Bollinger Bands, developed by John Bollinger, are a versatile tool that consists of a centerline and two bands. The centerline represents a simple moving average, while the upper and lower bands are calculated based on the standard deviation of price volatility. Traders often use the Bollinger Bands to identify overbought and oversold conditions, as well as to anticipate potential reversals or breakouts.
On the other hand, the Ichimoku Cloud, developed by Goichi Hosoda, is a comprehensive indicator that provides a holistic view of price action. It consists of several components, including the cloud, the Tenkan-sen (Conversion Line), the Kijun-sen (Base Line), and the Chikou Span (Lagging Span). By analyzing these components together, traders can identify trend direction, support and resistance levels, as well as potential entry and exit points.
By combining the power of the Bollinger Bands and the Ichimoku Cloud, traders can create a robust trading strategy that takes advantage of both volatility and trend analysis. This combination allows traders to filter out false signals and only take trades that have a higher probability of success. However, it is important to note that no trading strategy is foolproof, and it is essential to practice proper risk management and continuously adapt your approach based on market conditions.
In conclusion, understanding how to effectively use the Bollinger Bands and the Ichimoku Cloud can provide traders with valuable insights into market conditions and improve trading decisions. However, it is crucial to thoroughly study and practice using these indicators before implementing them in your trading strategy. With proper knowledge and experience, you can unleash the power of these indicators and potentially optimize your trading results.
The Bollinger Band and Ichimoku Strategy are two powerful technical analysis tools that traders can use to gain a competitive edge in the market. Both strategies provide insights into price action and can help identify trends, potential reversals, and entry and exit points for trades.
The Bollinger Band is a volatility indicator that consists of three lines: the upper band, the lower band, and the middle band. The upper and lower bands are calculated using a standard deviation formula, while the middle band represents the average price. Traders use the Bollinger Band to gauge whether a security’s price is overbought or oversold. When the price hits the upper band, it may indicate that the security is overbought and due for a correction. Conversely, when the price hits the lower band, it may indicate that the security is oversold and due for a rebound.
The Ichimoku Strategy, on the other hand, is a comprehensive technical analysis tool that provides a holistic view of a security’s price action. It is composed of five lines: Tenkan-sen (conversion line), Kijun-sen (base line), Senkou Span A (leading span A), Senkou Span B (leading span B), and Chikou Span (lagging span). The crossover of the Tenkan-sen and Kijun-sen lines can provide signals for trend reversals, while the Senkou Span A and Senkou Span B lines create a cloud or kumo that can indicate support and resistance levels.

By combining the Bollinger Band and Ichimoku Strategy, traders can unlock the power of both indicators and enhance their trading decision-making process. For example, when the price hits the upper band of the Bollinger Band and the Tenkan-sen line crosses below the Kijun-sen line, it may signal a potential trend reversal and a possible short trade. Conversely, when the price hits the lower band of the Bollinger Band and the Tenkan-sen line crosses above the Kijun-sen line, it may signal a potential trend reversal and a possible long trade.
It is important to note that no trading strategy is foolproof, and traders should always use these indicators in conjunction with other tools and analysis techniques. Additionally, traders should practice proper risk management and always have an exit strategy in place to protect themselves from losses.
Read Also: When is the Best Time to Exercise ISO?
In conclusion, understanding and utilizing the Bollinger Band and Ichimoku Strategy can greatly benefit traders in their quest for profitability. These technical analysis tools provide valuable insights into price action and can help identify trading opportunities. By combining these indicators and incorporating them into their trading strategies, traders can unlock the power of the Bollinger Band and Ichimoku Strategy.
The Bollinger Band is a popular technical analysis tool that helps traders and investors identify potential price movements in a given security. It was created by John Bollinger in the 1980s and has since become widely used in the financial industry.
The Bollinger Band consists of three lines: the upper band, the lower band, and the middle band. The middle band is a simple moving average (SMA) of the security’s price over a specified period of time, usually 20 days. The upper and lower bands are calculated by adding and subtracting a multiple of the standard deviation of the price from the middle band.
The standard deviation is a measure of the stock’s volatility, and the multiple is typically set to two. This means that the upper band is positioned two standard deviations above the middle band, and the lower band is positioned two standard deviations below the middle band.
When the price of a security is trading near the upper band, it is considered overbought, and there may be a possibility of a price reversal or consolidation. Conversely, when the price is trading near the lower band, it is considered oversold, and there may be a potential for a price rebound or consolidation in the opposite direction.
In addition to identifying potential price reversals, the Bollinger Band can also be used to gauge the strength of a trend. When the bands are widening, it indicates that the volatility is increasing, which may imply a strong trending market. Conversely, when the bands are contracting, it suggests that the volatility is decreasing, which may imply a potential for a market consolidation or a range-bound market.
Read Also: Who determines a credit event? Find out who has the power to decide in the financial world
Traders and investors use the Bollinger Band in conjunction with other technical indicators and analysis techniques to make informed trading decisions. It is important to note that the Bollinger Band should not be used in isolation and should always be combined with other analysis tools to confirm potential price movements and reduce false signals.
Overall, the Bollinger Band is a valuable tool for understanding and analyzing price movements in the financial markets. It can help traders and investors identify potential opportunities and manage risk effectively.

The Bollinger Band strategy is a technical analysis tool that helps traders identify overbought and oversold conditions in the market. It consists of using two standard deviations above and below a moving average to create a band. Traders can use these bands to spot potential price reversals.
The Bollinger Band strategy works by plotting two standard deviations above and below a moving average. When the price touches or moves outside of these bands, it is considered to be overbought or oversold. Traders can use this information to make decisions about entering or exiting trades.
The Ichimoku strategy is a technical analysis tool that provides traders with a comprehensive view of the market. It consists of several components, including the Tenkan-sen, Kijun-sen, Senkou Span A and B, and the Chikou Span. These components help traders identify trends, support and resistance levels, and potential trade signals.
The Ichimoku strategy works by using a combination of different lines and components to provide traders with a comprehensive view of the market. The Tenkan-sen and Kijun-sen lines help identify trends, while the Senkou Span A and B provide support and resistance levels. The Chikou Span helps confirm trade signals. By analyzing these components, traders can make informed decisions about their trades.
The Bollinger Band and Ichimoku strategies offer several advantages to traders. They provide valuable insights into market trends, overbought or oversold conditions, support and resistance levels, and potential trade signals. By using these strategies, traders can make more informed decisions and increase their chances of success in the market.
The Bollinger Band is a technical analysis tool that helps to identify potential price reversals and trend continuations. It consists of a simple moving average line in the middle, with two standard deviation lines plotted above and below it.
The Ichimoku strategy is a comprehensive technical analysis tool that helps traders to identify potential trends, support and resistance levels, and momentum in the market. It consists of multiple components, including the Cloud, the Kijun-sen line, the Tenkan-sen line, and the Chikou span.

What are the blue sky laws for ETF? The world of investing can be complex and overwhelming, especially when it comes to Exchange-Traded Funds (ETFs). …
Read Article
Using HFM with MT4: Everything You Need to Know High-Frequency Trading Market (HFM) is a popular trading strategy that relies on computer algorithms …
Read Article
Is the WTO a trading organization? The World Trade Organization (WTO) is often referred to as a trading organization, but is it really just that? This …
Read Article
Trading Economic Events: Strategies and Tips Economic events play a crucial role in the world of trading. Whether it’s an interest rate decision, a …
Read Article
Reasons behind the decreasing forex reserves in India India, one of the world’s largest economies, is facing a concerning trend in recent years - the …
Read Article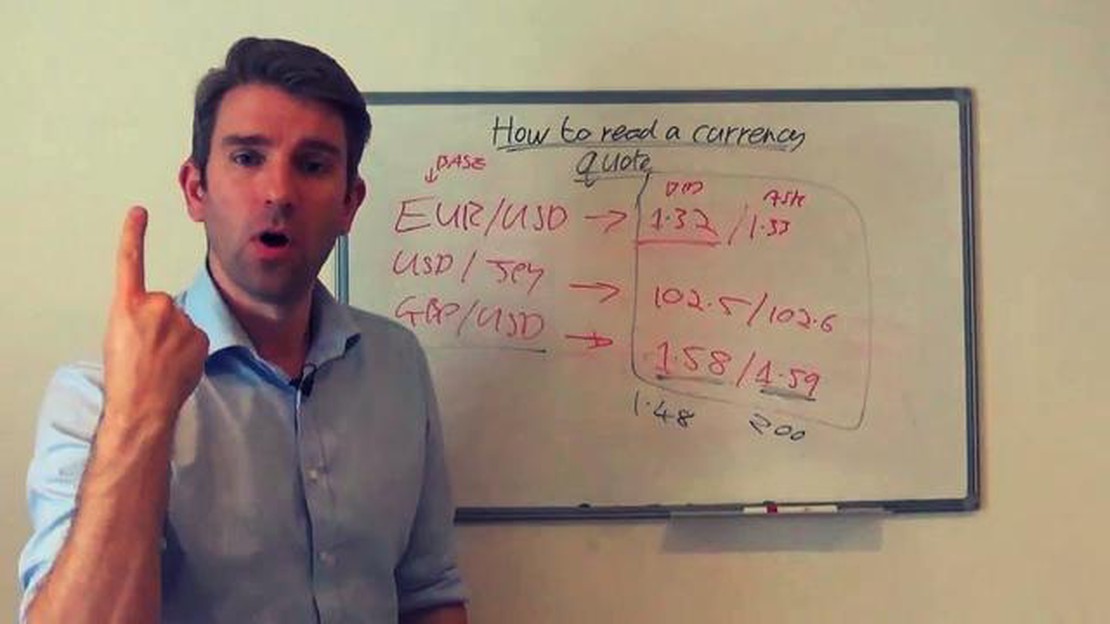
Understanding Forex Quotes: How to Read and Interpret Them When trading in the foreign exchange market (forex), one of the most important aspects is …
Read Article


