
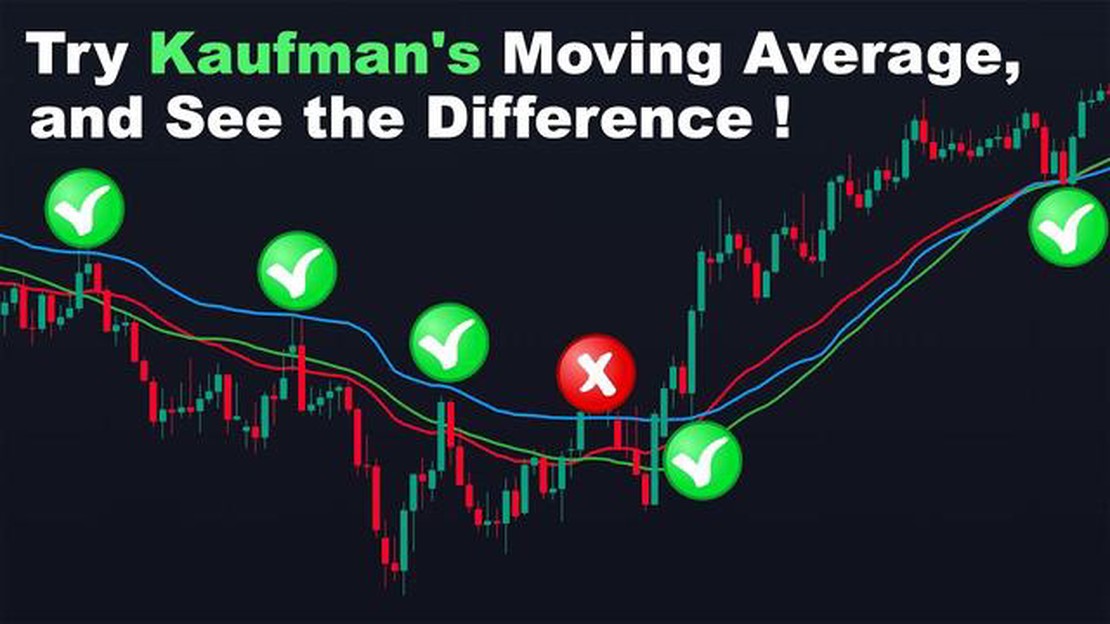

Why adaptive moving average is a game-changer: benefits and advantages
Benefits of Adaptive Moving Average The adaptive moving average (AMA) is a technical indicator that has revolutionized the field of financial …
Read Article
The Bollinger Band is a technical analysis tool that is widely used by traders to help them make informed decisions in the financial markets. This guide aims to provide a comprehensive understanding of the Bollinger Band and how it can be used effectively.
The Bollinger Band was developed by John Bollinger in the 1980s and is based on the concept of volatility. It consists of three lines: the middle band, which is a simple moving average (SMA) of the price; the upper band, which is the middle band plus two standard deviations; and the lower band, which is the middle band minus two standard deviations.
The Bollinger Band is typically plotted on a price chart and provides a visual representation of price volatility. When the price is in a period of low volatility, the Bollinger Bands contract, and when the price is experiencing high volatility, the Bollinger Bands expand.
Traders use the Bollinger Band to identify potential trading opportunities. When the price reaches the upper band, it may be considered overbought, and when it reaches the lower band, it may be considered oversold. Traders can also look for price bounces off the bands or the bands narrowing before a potential breakout.
This guide will cover the calculation of the Bollinger Band, how to interpret the bands, common trading strategies using the Bollinger Band, and potential limitations and risks of relying solely on the Bollinger Band for trading decisions.
Bollinger Bands are a popular technical analysis indicator developed by John Bollinger in the 1980s. They consist of three lines: a simple moving average (SMA) in the middle and an upper and lower band that fluctuate around the SMA.
The purpose of Bollinger Bands is to provide traders with information about the volatility and potential price levels of a security. They are based on the concept that prices tend to stay within the upper and lower bands, and when they deviate too far from the average, a reversal or correction may occur.
The upper band is calculated by adding a certain number of standard deviations to the SMA, while the lower band is calculated by subtracting the same number of standard deviations from the SMA. The most common setting used is a 20-period SMA with two standard deviations.

Bollinger Bands are often used in conjunction with other technical indicators to confirm signals or identify potential entry and exit points for trades. They can be applied to various financial instruments, such as stocks, bonds, commodities, and currencies.
Traders interpret Bollinger Bands in different ways. For example, when the price is touching or crossing the upper band, it may be considered overbought, and a reversal to the downside is expected. Conversely, when the price is touching or crossing the lower band, it may be considered oversold, and a reversal to the upside is expected.
Read Also: Step-by-step Guide: Setting a Pending Order in MQL4
Bollinger Bands are also used to identify periods of low volatility, as the bands contract when volatility decreases. This can be an indication that a breakout or significant price movement is imminent.
It is important to note that Bollinger Bands are not foolproof and should not be used as the sole basis for making trading decisions. They are merely a tool to help traders analyze and interpret price action and volatility.
In conclusion, Bollinger Bands are a versatile technical analysis tool that can provide valuable insights into price levels, volatility, and potential market reversals. Traders should use them in combination with other indicators and analysis techniques to make informed trading decisions.
Bollinger Bands are a technical analysis tool that helps traders to visually interpret market volatility and identify potential trading opportunities. They consist of a simple moving average (SMA) line in the middle and two standard deviation bands above and below it. The standard deviation bands are typically set two standard deviations away from the SMA line.
The middle line, or SMA, represents the average price of the asset over a specified period of time. The standard deviation bands help depict the volatility of the price by showing potential upper and lower boundaries within which the price is expected to fluctuate.
When the price of the asset moves towards the upper band, it indicates an overbought condition, suggesting that the price may be due for a downward correction. Conversely, when the price approaches the lower band, it signals an oversold condition, indicating that the price may be due for an upward correction.
Bollinger Bands can also be used to identify periods of low volatility when the bands are narrow, indicating that the price is trading in a tight range. This can be followed by periods of high volatility when the bands widen, signaling potential breakouts or trend reversals.
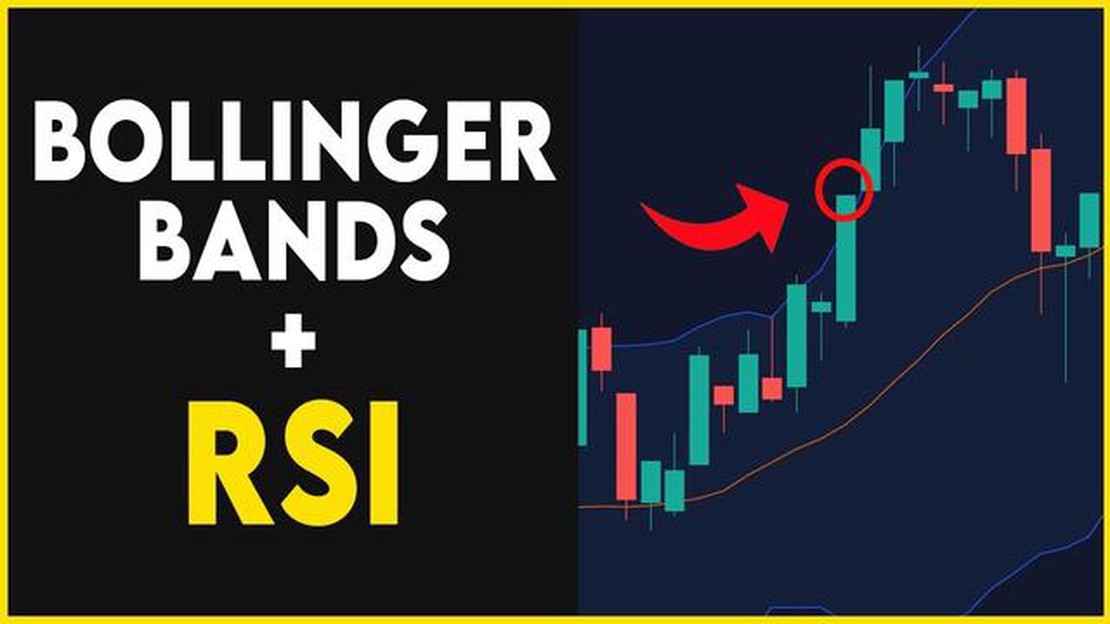
Traders often use Bollinger Bands in conjunction with other technical indicators to confirm potential trading signals. For example, a trader might look for a price crossover above the upper band combined with other indicators, such as the Relative Strength Index (RSI), to confirm a potential short-selling opportunity.
Read Also: Exploring the Connection Between EPS and Stock Price for Investors
It’s important to note that Bollinger Bands are not foolproof and should be used in conjunction with other forms of analysis. They provide a useful visual representation of market volatility, but traders should always consider other factors such as market trends, fundamentals, and risk management strategies before making trading decisions.
In summary, Bollinger Bands are a popular technical analysis tool that help traders identify potential trading opportunities based on market volatility. By understanding how Bollinger Bands work and incorporating them into a comprehensive trading strategy, traders can enhance their decision-making process and improve their overall trading performance.

A Bollinger Band is a technical analysis tool that consists of a moving average line in the middle and two standard deviation lines above and below it.
Bollinger Bands are calculated by first setting a moving average line at the desired time period and then calculating the standard deviation of the price data over a certain number of time periods.
Bollinger Bands are commonly used by traders to identify price extremes, detect volatility patterns, and determine potential trend reversals.
Bollinger Bands can indicate a potential trend reversal when the price touches or crosses one of the outer bands, suggesting that the price may have reached an extreme and could reverse direction.
While Bollinger Bands can be a useful tool for technical analysis, it’s important to remember that no indicator is infallible and should be used in conjunction with other indicators and analysis methods to make informed trading decisions.
The Bollinger Band is a technical analysis tool that consists of a moving average line, along with two standard deviation lines that are plotted above and below the moving average. It is used to measure volatility and identify potential overbought or oversold conditions in a market.
Bollinger Bands are calculated using a simple moving average (SMA) line, typically with a 20-period setting. The upper band is calculated by adding two times the standard deviation of the price to the SMA line, while the lower band is calculated by subtracting two times the standard deviation from the SMA line.

Benefits of Adaptive Moving Average The adaptive moving average (AMA) is a technical indicator that has revolutionized the field of financial …
Read Article
CySEC: Country of Regulation The Cyprus Securities and Exchange Commission (CySEC) is a regulatory authority that operates in the Republic of Cyprus. …
Read Article
Recording Stock Options Exercise: Best Practices and Guidelines Recording the exercise of stock options is an important process for both individuals …
Read Article
How much is $100 US in HK? Are you planning a trip to Hong Kong and wondering how much you can get for your money? In this currency conversion guide, …
Read Article
Manchester City’s Cryptocurrency Sponsorship: Who’s Involved? In a groundbreaking move, Manchester City Football Club has announced a groundbreaking …
Read Article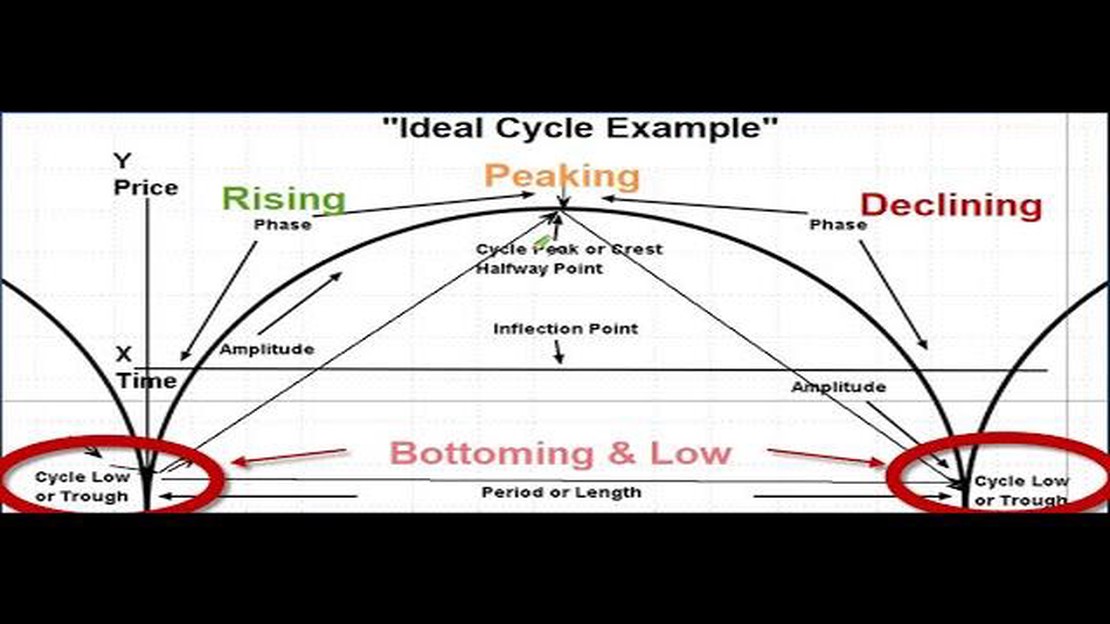
Understanding the Hurst Cycle Trader Strategy Successful trading in the financial markets requires a solid understanding of various strategies and …
Read Article


