


Understanding the Formula for VAR Model: A Comprehensive Guide
Formula for VAR Model The Vector Autoregressive (VAR) model is a statistical model commonly used to analyze the dynamic relationship between multiple …
Read Article
Trading in the financial markets can be a complex and challenging endeavor. Traders are constantly searching for patterns and indicators that can help them make informed trading decisions. One such pattern that has gained popularity among traders is the ABCD ratio pattern.
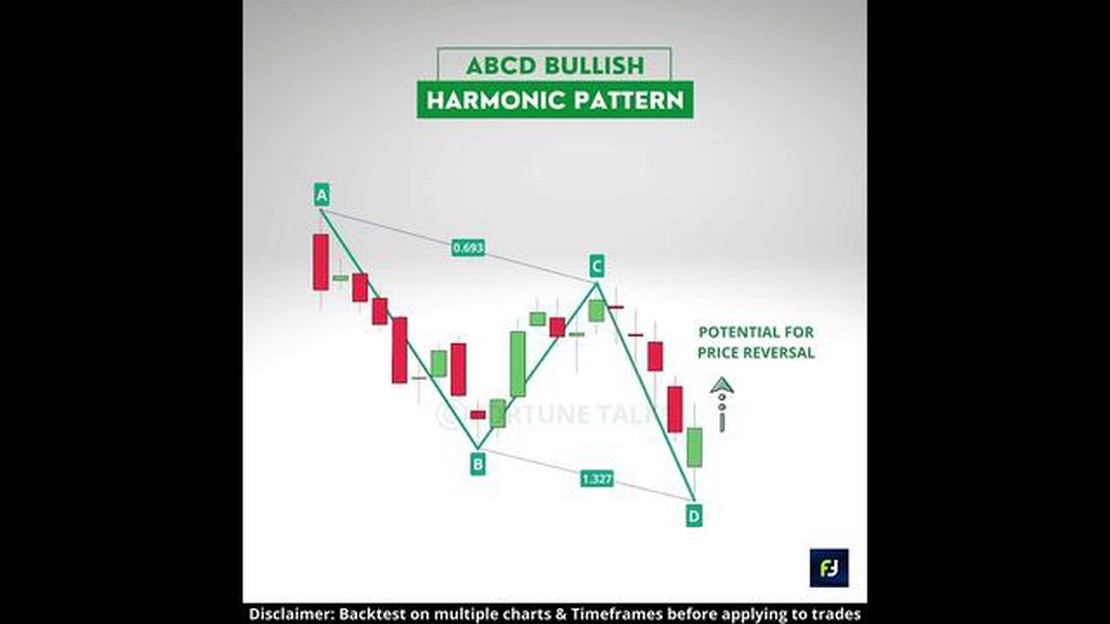
The ABCD ratio pattern is a visual tool that helps traders identify potential entry and exit points in the market. It is a geometric pattern that consists of four price swings: two legs in the same direction (AB and CD) and two corrective legs (BC and CD). Traders use Fibonacci ratios to determine the length and structure of each leg, which allows them to predict future price movements.
By studying historical price data, traders can identify the ABCD ratio pattern and use it to anticipate market reversals and trend continuations. When the pattern is complete, traders can enter a trade with a high probability of success, as they have identified a potential turning point in the market.
It is important to note that the ABCD ratio pattern is just one tool in a trader’s toolbox. It should be used in conjunction with other technical indicators and analysis methods to confirm trading signals and manage risk effectively. Additionally, traders should always practice proper risk management techniques and be aware of the risks associated with trading in the financial markets.
In conclusion, understanding the ABCD ratio pattern can be a useful tool for traders looking to improve their trading strategies. By identifying and correctly interpreting this pattern, traders can increase their chances of making profitable trades and achieving their financial goals.
The ABCD ratio pattern is a popular trading pattern used by traders to identify potential trend reversals in financial markets. It is based on the Fibonacci sequence, a mathematical sequence that is found in nature and often applied to market analysis.

The pattern consists of four distinct points, labeled A, B, C, and D. Each point represents a specific price level. Point A is the starting point of the pattern, while point D represents the potential reversal point. Points B and C are intermediate levels that help define the pattern.
The ABCD ratio pattern follows a specific structure, with specific ratio relationships between the different points. The pattern begins with an initial move from point A to point B, which is known as the AB leg. This leg is typically a retracement of the previous trend.
Next, the market moves from point B to point C, which is known as the BC leg. This leg is typically a retracement of the AB leg, and it usually forms a 0.618 Fibonacci retracement level. The BC leg then continues to point D, forming the CD leg.
The length of the CD leg is typically equal to the length of the AB leg. This forms the 1:1 ratio, which is one of the key characteristics of the ABCD ratio pattern. However, it is important to note that the CD leg can also extend beyond the 1:1 ratio, forming different ratio relationships.
Read Also: Should I go long or short? Pros and cons of long-term and short-term strategy
Traders use the ABCD ratio pattern to identify potential trade setups. The pattern can be used to anticipate potential trend reversals and price targets. Traders often enter a trade at point D, with a target at the completion of the CD leg or at specific Fibonacci levels.
It is important to note that the ABCD ratio pattern is not always accurate and should be used in conjunction with other technical analysis tools and indicators. Like any trading pattern, it is important for traders to practice proper risk management and use appropriate stop-loss levels to protect their capital.
| Key Points |
|---|
| - The ABCD ratio pattern is a popular trading pattern used to identify potential trend reversals. |
| - The pattern consists of four points: A, B, C, and D. |
| - The pattern follows a specific structure with specific ratio relationships between the points. |
| - Traders use the pattern to anticipate potential trade setups and price targets. |
| - The pattern should be used in conjunction with other technical analysis tools and indicators. |
The ABCD ratio pattern is a popular technical analysis tool used by traders to identify potential price reversals in the financial markets. It is based on the Fibonacci sequence, which is a mathematical pattern that occurs in nature and has been observed in the movements of financial assets.
Read Also: What is the tax rate for SPX? Understanding the tax implications of investing in SPX
The pattern is composed of four key points, labeled as points A, B, C, and D. Point A is the starting point of the pattern, usually representing the beginning of an uptrend or downtrend. Point B is a retracement from the initial move, often indicating a temporary counter-trend movement. Point C is the resumption of the original trend, surpassing the high or low point created by point A. Point D is the completion of the pattern, as it reaches a Fibonacci extension level.
The ABCD ratio pattern is considered valid if the ratio between the lengths of the BC and AB legs is approximately equal to the ratio between the lengths of the CD and BC legs. This ratio is often referred to as the “ABCD ratio” or the “ABCD harmonic ratio”. Traders look for this harmonic ratio to confirm the validity of the pattern and to anticipate potential reversal levels.
This pattern can be found in various financial markets, including stocks, forex, and commodities. Traders use it as a tool to forecast potential price movements and identify entry and exit points for their trades. By understanding the ABCD ratio pattern, traders can gain an edge in the markets and improve their trading strategies.
It is important to note that the ABCD ratio pattern is not foolproof, and traders should use it in conjunction with other technical indicators and analysis techniques to increase the probability of successful trades. Like any other trading strategy, it is subject to market conditions and can produce false signals.

The ABCD Ratio pattern is a technical analysis pattern that helps traders identify potential buying or selling opportunities in the market. It is named after the four points it consists of: A, B, C, and D. The pattern resembles a lightning bolt on the price chart and is formed by the ratio of the distances AB and CD. Traders can use Fibonacci retracement levels to determine the potential reversal points and trade accordingly.
The accuracy of the ABCD Ratio pattern in predicting market reversals can vary. It’s important to note that no trading pattern or strategy is 100% accurate. The ABCD Ratio pattern should be used in conjunction with other technical analysis tools and indicators to increase the probability of a successful trade. Traders should also consider other factors such as market conditions, volume, and news events to make well-informed trading decisions.
Yes, the ABCD Ratio pattern can be used in any financial market, including stocks, forex, commodities, and cryptocurrencies. The pattern is based on price action and can be observed in various markets. However, it’s important to adapt the pattern to the specific characteristics of each market and use appropriate risk management techniques when trading.
Yes, traders can use other technical analysis indicators and tools to confirm the ABCD Ratio pattern. Some commonly used indicators include moving averages, oscillators (such as the RSI or Stochastic), and trend lines. These indicators can help traders identify additional signals or patterns that align with the ABCD Ratio pattern, increasing the confidence in a trade setup.
The ABCD Ratio pattern can be used by beginners, but it’s important to have a solid understanding of technical analysis concepts and risk management principles. Beginners may find it helpful to study and practice using the pattern on historical price charts before applying it in live trading. It’s also recommended to seek guidance from experienced traders or educational resources to learn how to effectively use the ABCD Ratio pattern.

Formula for VAR Model The Vector Autoregressive (VAR) model is a statistical model commonly used to analyze the dynamic relationship between multiple …
Read Article
Is pyramid trading Legal? Pyramid schemes have been a topic of discussion for many years, with individuals questioning their legality and ethical …
Read Article
Understanding Options on Stock Indices and Currencies Options are a powerful financial instrument that allows investors to profit from the price …
Read Article
Is MetaTrader 4 legal in Singapore? If you are a trader or investor in Singapore, you may be wondering whether using MetaTrader 4 (MT4) is legal in …
Read Article
Is there trading in AQW? AdventureQuest Worlds (AQW) is an online multiplayer role-playing game where players can embark on epic quests, battle fierce …
Read Article
Understanding the Mechanics and Benefits of Phantom Shares Phantom shares are a unique financial instrument that allows companies to incentivize their …
Read Article


