


FTSE 100 Options: A Comprehensive Guide to Trading Options on the FTSE 100 Index
Exploring FTSE 100 Options: An In-Depth Analysis Options trading can be an excellent way for investors to diversify their portfolios and potentially …
Read Article
Investing in the financial markets can be a daunting task, especially for beginners. One of the tools that investors often use to analyze stock trends and make informed decisions is the 200-day moving average. The 200-day moving average is a popular indicator that provides valuable insights into the long-term performance of a stock or an entire market.
The 200-day moving average is calculated by taking the average closing price of a stock over the past 200 trading days. It is a smooth line that captures the overall trend of the stock’s price movement over time. By comparing the current price of a stock to its 200-day moving average, investors can determine whether the stock is in an uptrend or a downtrend.
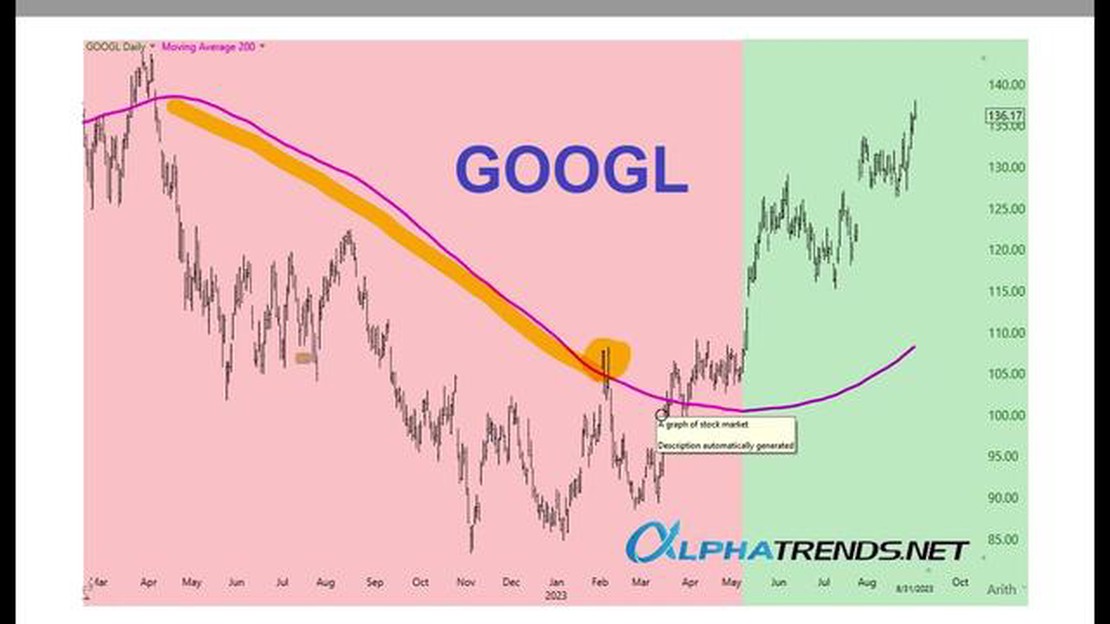
When a stock’s price is trading above its 200-day moving average, it is generally considered to be in an uptrend. This indicates that the stock has been performing well over the long term and may continue to do so in the future. On the other hand, if a stock’s price is trading below its 200-day moving average, it is typically in a downtrend, which suggests that the stock has been underperforming and may continue to experience downward pressure.
The significance of the 200-day moving average lies in its ability to filter out short-term noise and provide a clearer picture of a stock’s long-term trend. It acts as a support or resistance level, helping investors identify potential buying or selling opportunities. Additionally, the 200-day moving average can be used as a signal for trend reversals, as a significant break above or below this level may indicate a change in the stock’s overall direction.
In conclusion, understanding the 200-day moving average is essential for investors who want to make more informed decisions in the financial markets. By comparing a stock’s current price to its 200-day moving average, investors can assess its long-term trend and determine whether it is a good investment opportunity. Whether you are a novice or experienced investor, incorporating the 200-day moving average into your analysis can help you navigate the complex world of investing with more confidence and precision.
The 200-day moving average is a widely used technical indicator in the world of investing. It is a tool that investors, traders, and analysts use to understand the overall trend and direction of a security or an index.
The 200-day moving average calculates the average price of a security over a 200-day period, taking into account the closing price of each trading day. As new data becomes available, the oldest data point is dropped, and the newest data point is added. This creates a moving average line that moves along with the price of the security.
The importance of the 200-day moving average lies in its ability to provide insights into the long-term trend of a security. By smoothing out short-term fluctuations and noise in the market, it helps investors identify the underlying direction of the security’s price movement.

When the price of a security is above its 200-day moving average, it is often considered to be in an uptrend or a bullish phase. This implies that the security’s price is generally moving higher over the long run. On the other hand, when the price is below its 200-day moving average, it is often seen as being in a downtrend or a bearish phase, indicating that the price is generally moving lower.
Investors also pay attention to the relationship between the price of a security and its 200-day moving average. When the price crosses above the 200-day moving average, it is known as a bullish crossover, suggesting a potential buying opportunity. Conversely, when the price crosses below the 200-day moving average, it is referred to as a bearish crossover, indicating a possible selling opportunity.
While the 200-day moving average can provide valuable insights, it should not be used as the sole basis for making investment decisions. It is crucial to consider other technical indicators, fundamental analysis, and market conditions before making any investment choices.
Read Also: Is Meta Trader 5 a broker? | Exploring the features and functionality
In conclusion, understanding the 200-day moving average and its importance can help investors gain a better understanding of the long-term trend and direction of a security. By using this tool alongside other analysis methods, investors can make more informed investment decisions.
The 200-day moving average is a technical indicator commonly used in the financial markets to analyze the long-term trend of a particular stock or an index. It is calculated by averaging the closing prices of the asset for the past 200 trading days, which can represent approximately one year of trading.
The moving average is called “moving” because it is calculated based on the most recent data available. As new data is added, older data points are dropped from the calculation, resulting in a constantly updated average over the specified time period.
The 200-day moving average is considered significant because it is widely used by traders and investors to determine the overall direction of a stock or an index. It smooths out short-term fluctuations and provides a more accurate picture of the underlying trend.
Read Also: SGD to PHP Exchange Rate in Singapore: Current Conversion Rates & Updates
When the price of an asset is above its 200-day moving average, it is generally considered to be in an uptrend, indicating that the stock or index is showing positive momentum. Conversely, when the price falls below the 200-day moving average, it is often viewed as a signal of a downtrend or a potential reversal in the trend.
| Advantages | Disadvantages |
|---|---|
| - Provides a smooth trendline | - Delayed signals |
| - Offers a long-term perspective | - Can lag during periods of high volatility |
| - Widely used by traders and investors | - May not work well in trending markets |
Overall, the 200-day moving average is a popular technical indicator that can help investors identify the long-term trend of a stock or an index. It provides a simple yet effective way to filter out short-term noise and focus on the broader market direction.

The 200-day moving average is a popular technical analysis tool used by investors to identify trends in a price over a longer period of time. It is calculated by adding up the closing prices of an asset over the past 200 trading days and dividing the sum by 200 to get an average. This average is then plotted on a chart to visually represent the trend.
The 200-day moving average is used as a tool to determine the overall direction of a stock, index, or other investment. When the price is consistently above the 200-day moving average, it is considered a bullish signal, indicating a potential uptrend. Conversely, when the price is consistently below the 200-day moving average, it is considered a bearish signal, indicating a potential downtrend. Investors may use this information to make decisions about buying or selling investments.
The 200-day moving average is important to investors because it helps to smooth out short-term price fluctuations and provides a longer-term perspective on the trend of an investment. It can help investors avoid making hasty decisions based on short-term market volatility and instead focus on the overall trend. Additionally, the 200-day moving average is a commonly followed indicator among traders and investors, which can lead to self-fulfilling prophecies as market participants react to its signals.
Yes, the 200-day moving average can be used for any type of investment that has a price or value that can be charted over time. This includes stocks, bonds, commodities, indexes, and even currencies. The concept of the 200-day moving average can be applied to any investment where tracking the long-term trend is relevant and important for decision-making.
While the 200-day moving average can be a useful tool, it does have limitations. One limitation is that it is a lagging indicator, meaning it may not give timely signals of a trend reversal. By the time the price crosses above or below the 200-day moving average, a significant portion of the move may have already occurred. Additionally, the 200-day moving average may not be as effective in choppy or sideways markets where the price fluctuates around the average. As with any technical analysis tool, it is important to use the 200-day moving average in conjunction with other indicators and analysis techniques for a more comprehensive view.
The 200-day moving average is a calculation that helps investors gauge the long-term trend of a stock or market. It is the average closing price of a security or index over the past 200 trading days.
The 200-day moving average is calculated by adding up the closing prices of a security or index over the past 200 trading days and dividing it by 200. This gives the average price over that time period.

Exploring FTSE 100 Options: An In-Depth Analysis Options trading can be an excellent way for investors to diversify their portfolios and potentially …
Read Article
Should You Trade on Expiry Date? Trading on expiration can be a lucrative strategy for experienced traders who are looking to take advantage of …
Read Article
What is the best combination indicator with RSI? When it comes to trading in the financial markets, having the right tools and indicators can make all …
Read Article
Discover the Possibilities of Level 2 Options Trading Options trading has long been a popular choice for investors looking to diversify their …
Read Article
When does the New York trading session end? The New York trading session, one of the most important sessions in the global financial markets, is known …
Read Article
Art of Living: Who is the Owner? The Art of Living is a global organization that offers programs to help individuals lead a more fulfilling and …
Read Article


