

Top Tips for Learning and Understanding Forex Trading
Learn the Fundamentals of Forex Trading and Gain a Comprehensive Understanding of the Market Forex trading can be a challenging and potentially …
Read Article
The stock market is a dynamic and complex field, where investors constantly search for effective tools to make informed decisions. One such tool is the Simple Moving Average 5 (SMA 5), which has gained popularity due to its ability to provide valuable insights into market trends.
The SMA 5 is a technical analysis indicator that calculates the average price of a stock over a specified period, typically five trading days. It is a widely used tool among traders and investors to identify potential entry and exit points.
The concept behind the SMA 5 is relatively straightforward. By smoothing out price fluctuations over a short-term period, it gives a clearer picture of the overall trend. When the current stock price is above the SMA 5, it indicates a bullish trend, and when it is below, it suggests a bearish trend.
This indicator is particularly useful as it helps traders identify short-term price reversals and confirm the validity of a trend. It can be used on various timeframes, from intraday to monthly charts, making it adaptable to different trading styles and strategies.
Moreover, the SMA 5 can be combined with other technical indicators, such as the SMA 20 or exponential moving averages (EMAs), to generate more reliable signals. Traders often look for a crossover between the SMA 5 and SMA 20, as it may indicate a change in the overall trend.
However, like any indicator, the SMA 5 is not foolproof and should be used in conjunction with other analysis tools and risk management techniques. It is essential to consider other factors, such as market conditions, company fundamentals, and news events, before making any trading decisions.
In conclusion, the Simple Moving Average 5 is a powerful indicator that can assist traders and investors in navigating the complexities of the stock market. By providing insights into market trends, it helps identify potential buying and selling opportunities. Nevertheless, it should be used in conjunction with other analysis tools and a comprehensive risk management strategy to maximize its effectiveness.
The Simple Moving Average (SMA) 5 is a popular indicator in stock market analysis. It is a calculation that helps traders understand the average price of a security over a specific period of time. In the case of SMA 5, it calculates the average price over the past 5 periods.
To calculate the SMA 5, you add up the closing prices of a security over the past 5 periods and then divide the sum by 5. Each period can be a day, week, month, or any other time frame depending on the trader’s preference and trading strategy.
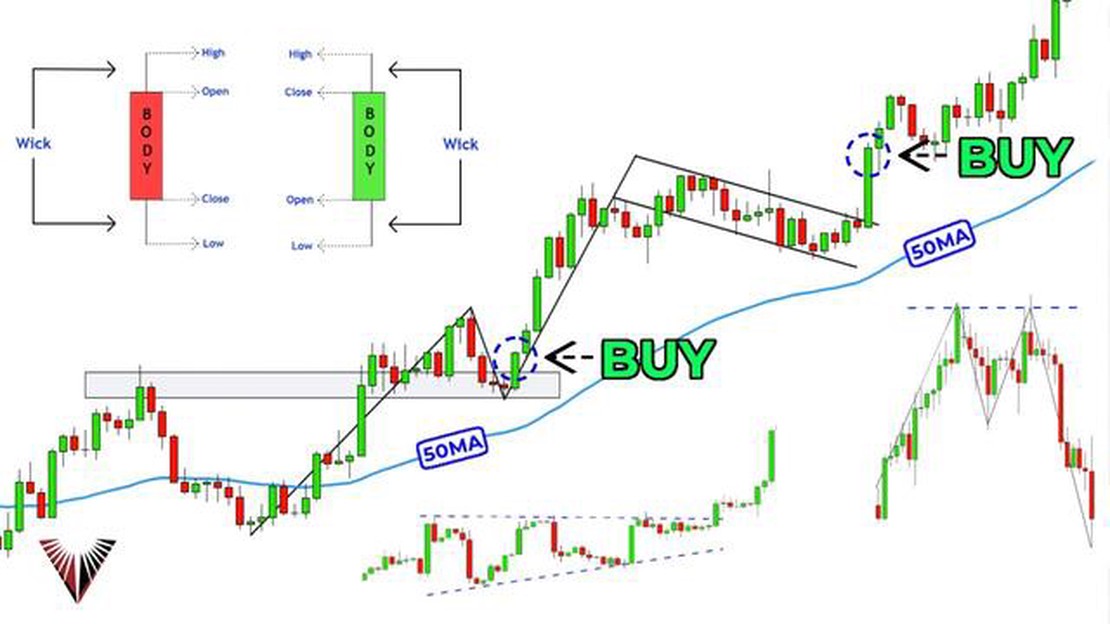
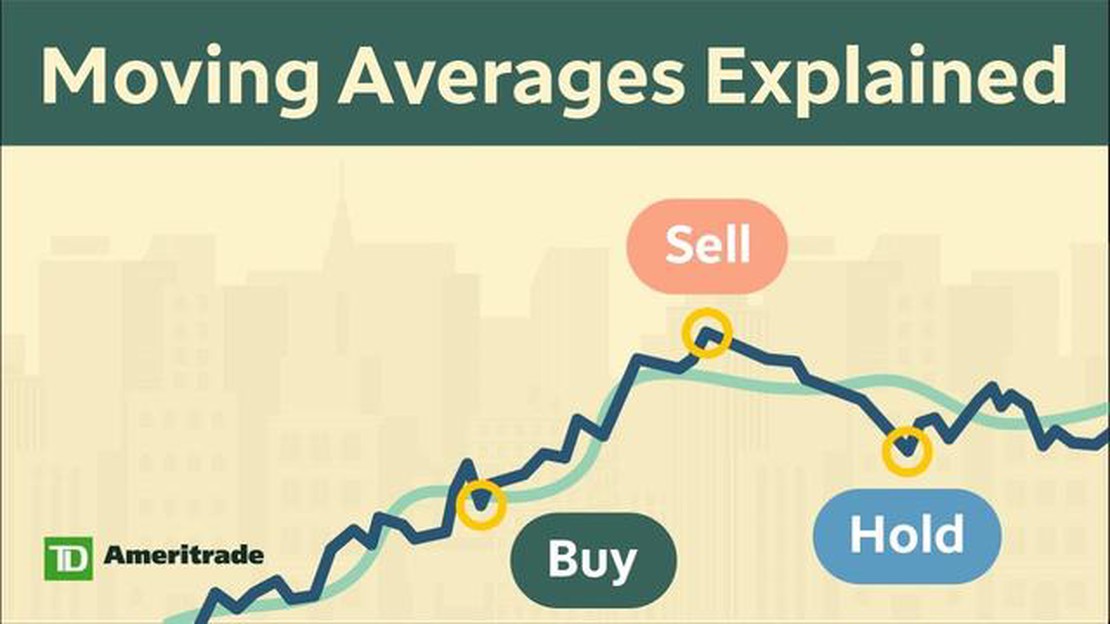
The SMA 5 is used to identify trends and potential trading opportunities. When the price of a security is above the SMA 5, it suggests an uptrend, and when the price is below the SMA 5, it suggests a downtrend. Traders often use these signals to make buy or sell decisions.
Additionally, the SMA 5 can also act as a support or resistance level. If the price of a security approaches the SMA 5 from below and bounces off it, it can be considered a support level. Conversely, if the price approaches the SMA 5 from above and fails to break through, it can be considered a resistance level.
It’s important to note that the SMA 5 is a lagging indicator, meaning it provides information based on past price data. Therefore, it’s not always the best indicator to use in fast-moving markets or during periods of high volatility. Traders often use it in combination with other indicators or as part of a broader trading strategy.
In conclusion, the Simple Moving Average 5 is a powerful tool that helps traders analyze price trends and identify potential entry and exit points in the stock market. By understanding how it works and interpreting its signals, traders can make more informed trading decisions.
The Simple Moving Average 5, or SMA 5, is a popular technical indicator used by stock market analysts to analyze price trends and forecast future price movements. It is calculated by taking the average of the last 5 closing prices of a stock or other financial asset.

The SMA 5 is a lagging indicator, which means it is based on past price data rather than predicting future prices. However, it can provide valuable insights into the overall trend of a stock and help traders make informed decisions.
By calculating the average of the last 5 closing prices, the SMA 5 smooths out short-term price fluctuations and provides a clearer picture of the overall price trend. This helps analysts identify support and resistance levels, as well as potential buying or selling opportunities.
The SMA 5 is often used in conjunction with other technical indicators to confirm or validate signals. For example, if the SMA 5 crosses above the SMA 20, it can be seen as a bullish signal, indicating that the stock’s price is likely to continue rising. Conversely, if the SMA 5 crosses below the SMA 20, it can be seen as a bearish signal, indicating that the stock’s price is likely to continue falling.
Read Also: Which Oscillator is the Best: A Comprehensive Comparison and Analysis
It is important to note that the SMA 5 is just one tool among many used in stock market analysis. It should be used in conjunction with other indicators and analysis techniques to make effective trading decisions.
In conclusion, the Simple Moving Average 5 is a powerful indicator that helps analysts understand the overall trend of a stock and identify potential buying or selling opportunities. By smoothing out short-term price fluctuations, it provides a clearer picture of the stock’s price movement. However, it is important to use it in conjunction with other tools and techniques to make well-informed trading decisions.
The Simple Moving Average 5 (SMA 5) is a powerful indicator in stock market analysis that provides several key benefits.
1. Trend Identification:
Read Also: Are robots programmed to run on binary code?
The SMA 5 helps traders and investors identify trends in the stock market. By calculating the average price over the past five periods, the SMA 5 smooths out short-term fluctuations and provides a clearer picture of the overall trend. This allows traders to make more informed decisions about whether to buy or sell stocks.
2. Support and Resistance Levels:
The SMA 5 can also be used to determine key support and resistance levels for a stock. When the stock price is above the SMA 5, it indicates a bullish trend and the SMA 5 can act as a support level. Conversely, when the stock price is below the SMA 5, it suggests a bearish trend and the SMA 5 can act as a resistance level. These levels can be useful for setting stop-loss orders and determining entry and exit points.

3. Confirmation of Breakouts:
The SMA 5 can be used as a confirmation tool for breakout trades. When the price of a stock breaks above or below the SMA 5, it can indicate a potential trend reversal or continuation. Traders can use this information to confirm other technical indicators or patterns, such as the moving average crossover or chart patterns, and make more accurate trading decisions.
4. Price Reversals:
The SMA 5 can also be helpful in identifying price reversals in the stock market. When the stock price crosses above or below the SMA 5, it can indicate a potential reversal in the current trend. Traders can use this signal as an early indication of a possible trend change and adjust their strategies accordingly.
5. Simple and Easy to Use:
One of the main benefits of the SMA 5 is its simplicity and ease of use. It is a straightforward indicator that can be easily incorporated into any stock market analysis. Traders and investors of all experience levels can utilize the SMA 5 to gain valuable insights into the market and make more effective trading decisions.
Overall, the Simple Moving Average 5 is a powerful tool that offers several benefits for traders and investors in stock market analysis. It helps identify trends, determine support and resistance levels, confirm breakouts, identify price reversals, and is simple and easy to use. By incorporating the SMA 5 into their analysis, traders can gain a competitive edge in the stock market.
The Simple Moving Average 5 is a commonly used technical indicator in stock market analysis. It is calculated by taking the average closing price of a stock over the past 5 periods.
The Simple Moving Average 5 is calculated by adding up the closing prices of a stock over the past 5 periods and then dividing that sum by 5.
The Simple Moving Average 5 is important in stock market analysis because it helps traders and investors identify trends and potential price reversals. It provides a smoothed line that represents the average price over the past 5 periods, allowing for easier identification of market direction.
If the stock price is above the Simple Moving Average 5, it suggests that the stock is in an uptrend. This can be a bullish signal for traders and investors, indicating that the stock is likely to continue rising in price.
The Simple Moving Average 5 can be used to make trading decisions by looking for crossovers with other moving averages or by using it as a support/resistance level. When the stock price crosses above the Simple Moving Average 5, it can signal a buying opportunity, while a cross below the indicator can signal a selling opportunity.
A simple moving average is a calculation used to analyze data points by creating a series of averages of different subsets of the full data set.

Learn the Fundamentals of Forex Trading and Gain a Comprehensive Understanding of the Market Forex trading can be a challenging and potentially …
Read Article
Exchange foreign currency at SBI If you are planning to travel abroad or have recently returned from a foreign trip, you may be wondering if you can …
Read Article
Can I exchange money at M Lhuillier? Are you planning a trip abroad? Need to exchange your currency? Look no further than M Lhuillier! This trusted …
Read Article
Understanding Algorithmic Trading in MiFID II Algorithmic trading has become an increasingly popular method of executing financial transactions. With …
Read Article
Trading Crude Options: A Comprehensive Guide Welcome to our comprehensive guide on trading crude options. Whether you’re a beginner looking to get …
Read Article
What are the 4 major trading currencies? When it comes to international trade and finance, certain currencies have emerged as dominant players on the …
Read Article


