


Are Company Annual Reports Public? Everything You Need to Know
Are company annual reports public? Company annual reports are an important source of information that provide insights into the financial health and …
Read Article
In the world of financial markets, trading is a complex and ever-evolving practice. Traders continuously look for ways to gain an edge over the competition, and one such tool that has gained immense popularity is the concept of R1, R2, R3, and Pivot Points. These levels play a crucial role in technical analysis, helping traders identify potential support and resistance areas, as well as crucial entry and exit points.
Before delving into the specifics, it is important to understand what exactly R1, R2, R3, and Pivot Points are. Simply put, these levels are calculated based on the previous day’s price action and are used as reference points to predict potential price movements in the future. R1, R2, and R3 represent resistance levels, while Pivot Points serve as a point of reference that helps traders gauge the overall market sentiment.
Technical analysis often involves drawing trend lines and analyzing various indicators to identify key areas of support and resistance. However, these levels can sometimes be subjective and differ from trader to trader. This is where R1, R2, R3, and Pivot Points prove to be useful, as they provide a standardized framework that traders can follow.
Traders use R1, R2, R3, and Pivot Points in various ways. For instance, if the price of an asset breaks above the R1 level, it is considered a bullish signal, indicating that the price may continue to rise. Conversely, if the price drops below the Pivot Point, it suggests a bearish sentiment and a potential downtrend. These levels can also be used to set stop-loss orders, take-profit targets, or to determine the strength of a trend.
In conclusion, understanding R1, R2, R3, and Pivot Points is essential for any trader looking to gain an edge in the financial markets. By incorporating these levels into their technical analysis, traders can make more informed decisions and improve their chances of successful trades. However, it is important to remember that trading involves risks, and relying solely on these levels may not guarantee profits. Traders must always consider multiple factors and use proper risk management strategies to mitigate potential losses.
Pivot points are technical indicators used in trading to determine potential levels of support and resistance. They are calculated based on the high, low, and close prices of the previous trading session or a set period of time.
The pivot point itself is the average of the high, low, and close prices. The support and resistance levels are then calculated based on this pivot point.
Pivot points are particularly useful for day traders and short-term traders as they provide insight into potential price levels where a security may reverse direction or experience a significant price move.
There are several types of pivot points, including the Classical, Woodie’s, and Camarilla pivot points. These calculation methods differ slightly in how they derive support and resistance levels, but the basic concept remains the same.
Traders often use pivot points in conjunction with other technical indicators and chart patterns to confirm or validate potential trading opportunities. They can be applied to various timeframes, from intraday charts to weekly and monthly charts.

In addition to support and resistance levels, pivot points can also be used to calculate other important levels, such as target prices for profit-taking or stop-loss levels to limit potential losses.
Overall, pivot points are a valuable tool in a trader’s arsenal, providing a framework for identifying potential price levels and making informed trading decisions based on historical price data.
In trading, R1, R2, and R3 levels refer to resistance levels above the current price. These levels are used by traders to identify potential areas of selling pressure and profit-taking.
R1 represents the first level of resistance, R2 represents the second level of resistance, and R3 represents the third level of resistance. These levels are calculated based on certain mathematical formulas, such as the pivot point formula.
When a stock or any other trading instrument approaches these resistance levels, it is likely to face selling pressure because traders who bought at lower prices may decide to take profits or sell their positions. This selling pressure can cause the price to reverse or stall temporarily.
Traders often use R1, R2, and R3 levels as potential areas to set profit targets or exit positions. If a trader is long (buying) a stock and the price approaches an R1, R2, or R3 level, they may consider selling some or all of their position to lock in profits.
Read Also: Understanding the Distinctions Between ARIMA and VARMA Models
On the other hand, if a trader is short (selling) a stock and the price approaches an R1, R2, or R3 level, they may consider covering (buying back) their short position to minimize potential losses if the price reverses and moves higher.
It is important to note that R1, R2, and R3 levels are not guaranteed reversal points. They are simply areas where traders often take action based on historical price patterns and psychological factors.
Read Also: When is the Australian forex session? Learn the best times to trade!
Traders use various technical analysis tools and indicators to confirm or invalidate the potential resistance at R1, R2, or R3 levels. These tools can include trendlines, moving averages, volume indicators, and oscillators.
In conclusion, understanding R1, R2, and R3 levels can be helpful for traders to identify potential areas of selling pressure and profit-taking. However, it is crucial to use these levels in conjunction with other technical analysis tools to make informed trading decisions.
Pivot points and R1 R2 R3 are important tools in trading that can help identify potential support and resistance levels. These levels can be used to make informed trading decisions and manage risk. Here are a few ways to use pivot points and R1 R2 R3 in trading:
1. Identify key support and resistance levels: Pivot points and R1 R2 R3 can help identify key levels that may act as support or resistance. When the price is approaching these levels, traders can look for potential reversals or breakouts.
2. Determine entry and exit points: Traders can use pivot points and R1 R2 R3 to determine entry and exit points for their trades. For example, if the price is above the pivot point and R1, it may be a signal to enter a long position. Conversely, if the price is below the pivot point and R1, it may be a signal to exit a long position.
3. Set stop-loss and take-profit levels: Pivot points and R1 R2 R3 can also be used to set stop-loss and take-profit levels. Traders can place their stop-loss orders below the pivot point or a key support level, and their take-profit orders near the next pivot point or a key resistance level.

4. Confirm other technical indicators: Pivot points and R1 R2 R3 can be used to confirm signals from other technical indicators. For example, if a moving average crossover signals a bullish trend reversal and the price is also approaching a pivot point or R1, it may provide additional confirmation of the potential reversal.
It’s important to note that pivot points and R1 R2 R3 should not be used as standalone indicators. They should be used in conjunction with other technical analysis tools and indicators to increase the probability of successful trades.
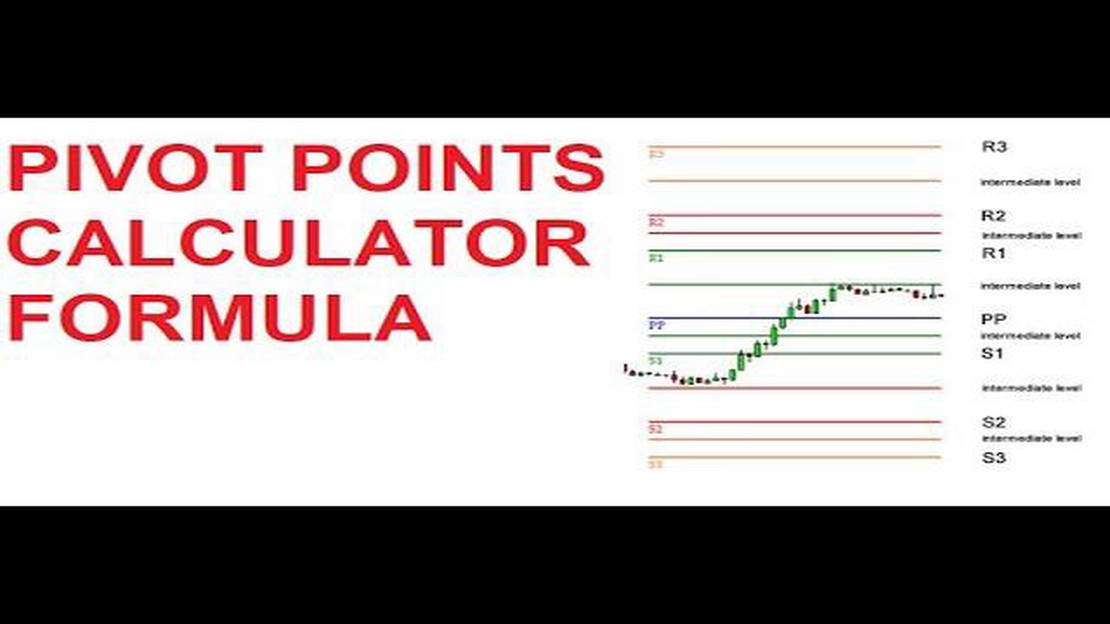
R1, R2, R3, and Pivot Points are technical analysis tools used by traders to identify potential support and resistance levels in the market. Pivot Points represent the average of the high, low, and closing prices from the previous trading day, while R1, R2, and R3 are levels above the pivot point that can act as resistance levels.
R1, R2, R3, and Pivot Points are calculated using a specific formula. To calculate the Pivot Point, you take the average of the high, low, and closing prices from the previous trading day. R1 is calculated by multiplying the Pivot Point by 2 and subtracting the low of the previous trading day. R2 is calculated by adding the difference between the high and low of the previous trading day to the Pivot Point. R3 is calculated by adding the difference between the high and low of the previous trading day multiplied by 2 to the Pivot Point.
R1, R2, R3, and Pivot Points can be used in trading to identify potential support and resistance levels. Traders can use these levels to make decisions about entry and exit points for trades, as well as to set stop loss and take profit levels. When the price reaches a Pivot Point or one of the resistance levels, it can indicate a potential reversal or continuation in the market.
R1, R2, R3, and Pivot Points are technical analysis tools that can provide valuable information about potential support and resistance levels in the market. While they are not foolproof and should not be relied upon solely for making trading decisions, they can be used in conjunction with other indicators and analysis techniques to help provide a more comprehensive view of the market and potential price movements.
Yes, pivot points and support/resistance levels can be used in all markets. While they may be more commonly associated with the stock market, they can also be applied to other markets such as forex, commodities, and cryptocurrencies. The concept of identifying key levels of support and resistance is applicable to any market where price movements are driven by supply and demand.
R1, R2, and R3 are resistance levels, while Pivot Points are levels where the market is expected to change direction. R1 is the first resistance level above the pivot point, R2 is the second resistance level, and R3 is the third resistance level. These levels are calculated using the high, low, and close prices of the previous trading session.

Are company annual reports public? Company annual reports are an important source of information that provide insights into the financial health and …
Read Article
History of Forex Market in India: When Did It Start? The foreign exchange market, also known as Forex or FX, has a long and rich history in India. The …
Read Article
Simple Average Method of Supply Chain Management The simple average method is a popular forecasting technique used in supply chain management. It is a …
Read Article
Understanding Trading Lots: What You Need to Know Trading lots are a fundamental concept in the world of trading. Whether you’re a novice trader or an …
Read Article
Companies and businesses located in the Twin Towers The Twin Towers, also known as the World Trade Center, were once the iconic symbols of New York …
Read Article
When is the Best Time to Exercise ESOP? Employee Stock Ownership Plans, or ESOPs, are a popular way for companies to provide their employees with a …
Read Article


