

Discover Whether a Bull Put Spread is a Buy or Sell Strategy
What is a Bull Put Spread: A Buy or Sell Strategy? A bull put spread is a popular options trading strategy that is used by investors who are bullish …
Read Article
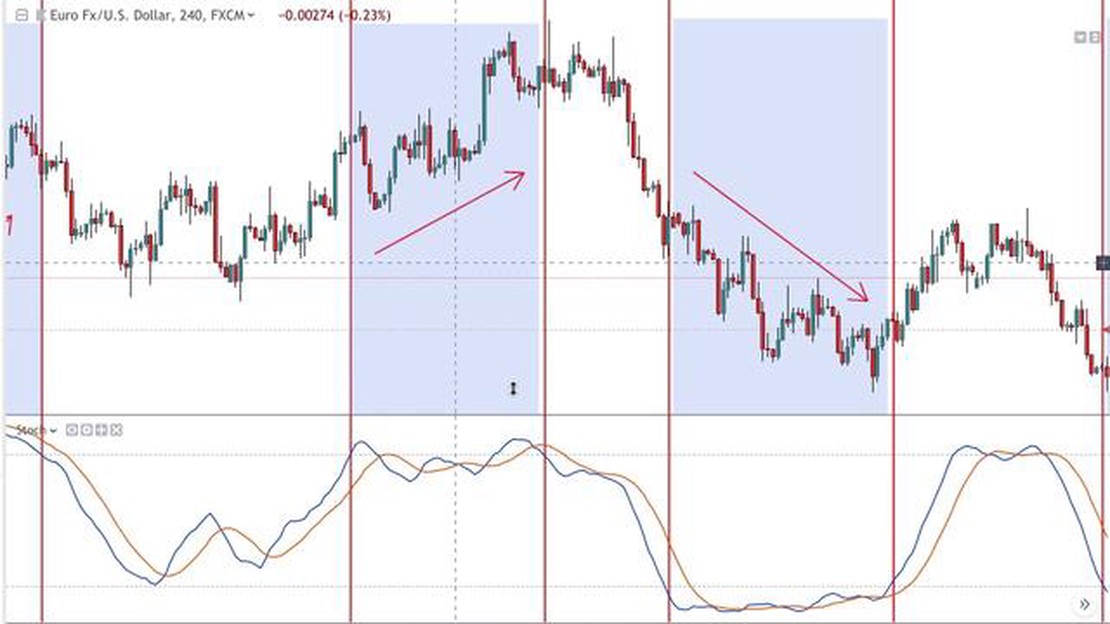
When it comes to analyzing financial markets, one of the key challenges is determining whether a particular asset is overbought or oversold. Overbought conditions occur when the price of an asset has risen too rapidly and is due for a correction. Various indicators are used to identify overbought conditions, including the Relative Strength Index (RSI), the Stochastic Oscillator, and the Moving Average Convergence Divergence (MACD).
Overbought indicators are often seen as a warning sign that a reversal or pullback may be imminent. These indicators measure the momentum and strength of a price trend, helping traders to identify potential turning points in the market. However, the interpretation of overbought indicators can vary, with some traders viewing them as bullish signals and others considering them bearish signals. It all depends on the trader’s perspective and trading strategy.
From a bullish perspective, overbought indicators signal that the demand for an asset is high and buyers are in control. This suggests that the price may continue to rise, as buyers continue to enter the market. Traders who adopt a bullish stance may view overbought conditions as an opportunity to buy or hold onto a position, expecting further upside potential.
On the other hand, from a bearish perspective, overbought indicators indicate that the price of an asset has reached unsustainable levels and is likely to reverse. This suggests that sellers may step in and push the price lower. Traders who take a bearish view may interpret overbought conditions as a signal to sell or consider taking profits.
In conclusion, understanding overbought indicators is an essential aspect of technical analysis in financial markets. While these indicators can provide valuable insights into market conditions, their interpretation as bullish or bearish signals depends on the trader’s perspective and trading strategy. It is important for traders to carefully consider other factors and use additional tools to confirm the validity of overbought signals before making any trading decisions.
An overbought indicator is a technical analysis tool used by traders and investors to evaluate the current market conditions and identify potential trading opportunities. It is commonly used to determine whether a security or an asset is overvalued or overbought, and whether it may be due for a price correction or reversal.
Overbought indicators are based on mathematical formulas and calculations that take into account various factors such as price, volume, and momentum. These indicators can be applied to different types of financial instruments, including stocks, bonds, commodities, and currencies.
When an overbought condition is detected, it suggests that the buying pressure in the market has become excessive and that prices may be unsustainable in the short term. This may indicate that investors have become overly optimistic and that a price correction or reversal may be imminent.

Common overbought indicators include the Relative Strength Index (RSI), the Stochastic Oscillator, and the Williams %R. These indicators generate numerical values that range from 0 to 100 and provide insights into the strength and direction of price movements.
Traders and investors use overbought indicators to anticipate potential market reversals or corrections and to adjust their trading strategies accordingly. When an overbought condition is identified, it may signal a sell or short opportunity, as the price may be due for a decline. Conversely, when an oversold condition is detected, it may suggest a buy or long opportunity, as the price may be poised for an upward move.
Read Also: Understanding EMA in Machine Learning: Everything You Need to Know
However, it’s important to note that overbought indicators should be used in conjunction with other technical analysis tools and indicators to confirm trading signals. Market conditions can change quickly, and relying solely on overbought indicators can lead to false signals and poor trading decisions.
Overall, overbought indicators are valuable tools for traders and investors to assess market conditions and identify potential trading opportunities. However, they should be used in conjunction with other analysis methods and indicators to make informed trading decisions.
Overbought indicators are technical analysis tools used in the stock market to identify when the price of a security has risen too far and too fast. These indicators are typically used by traders to determine whether a particular stock or market is due for a correction or reversal.
When a stock is considered overbought, it means that there is a high probability that the price has reached a level that is unsustainable in the short term. This can happen when there is excessive buying pressure or when market participants become overly optimistic about the future prospects of a stock.
Common overbought indicators include the Relative Strength Index (RSI), the Stochastic Oscillator, and the Money Flow Index. These indicators are based on mathematical formulas that analyze price and volume data to identify overbought conditions.
However, it is important to note that an overbought indicator does not necessarily mean that a stock or market is about to decline. In fact, some traders actually view overbought conditions as a bullish sign, as it indicates strong upward momentum in the short term. It is important to consider other factors, such as trend analysis and fundamental analysis, when interpreting overbought signals.
Read Also: What is M3 in Australia: Understanding the Motorway System
Traders who use overbought indicators often look for additional confirmation signals before making trading decisions. This can include looking for bearish candlestick patterns, divergences between price and indicator, or other technical analysis tools that suggest a reversal is likely.
Overall, overbought indicators are valuable tools for traders to assess the current state of a stock or market and make informed trading decisions. However, they should not be used in isolation and should be combined with other forms of analysis to gain a comprehensive understanding of market conditions.

It is also important for traders to remember that the effectiveness of overbought indicators can vary depending on market conditions and the specific security being analyzed. Therefore, it is crucial to continuously monitor and adapt trading strategies as market dynamics change.
In conclusion, overbought indicators are useful tools for traders to identify potentially unsustainable price levels in the short term. However, they should be used in conjunction with other forms of analysis to gain a more nuanced understanding of market conditions. Traders should also consider additional confirmation signals before making trading decisions.
Overbought indicators are technical tools used in trading to determine if a stock or other asset is overbought, meaning that its price has risen too far and too fast and may be due for a correction. These indicators help traders identify potential selling opportunities.
Overbought indicators work by using various mathematical formulas and calculations to analyze the price and volume data of a particular asset. They compare current price levels to historical price patterns and provide a numerical value that indicates whether the asset is overbought or oversold. Traders can use this information to make informed decisions about buying or selling.
No, overbought indicators are not always accurate. While they can provide valuable insights into market conditions, they should not be relied upon as the sole basis for making trading decisions. Other factors such as market trends, fundamental analysis, and overall market sentiment should also be taken into consideration.
Some common overbought indicators include the Relative Strength Index (RSI), the Stochastic Oscillator, and the Moving Average Convergence Divergence (MACD). These indicators use different calculations and parameters to determine overbought and oversold conditions.
The interpretation of overbought indicators as bullish or bearish depends on the trader’s perspective and the overall market conditions. In general, an overbought reading suggests that the price has risen too far and too fast and may be due for a correction. This could be seen as bearish by traders who expect the price to decline. However, other traders may interpret an overbought reading as a sign of strong upward momentum and view it as bullish.

What is a Bull Put Spread: A Buy or Sell Strategy? A bull put spread is a popular options trading strategy that is used by investors who are bullish …
Read Article
Understanding the Tax Rate for Forex Trading Forex trading has become increasingly popular in recent years, with many individuals looking to take …
Read Article
Understanding the Mechanics of Equity Stock Options Equity stock options are an integral part of the financial world, offering individuals and …
Read Article
How much do you earn as a Forex trader? Forex trading has gained popularity in recent years, attracting individuals from all walks of life who are …
Read Article
Best Forex Demo Account Options to Consider Are you interested in trading the foreign exchange market, but don’t want to risk your hard-earned money? …
Read Article
Understanding the 2 Point Moving Average Data analysis is an essential part of understanding and interpreting data, and there are various techniques …
Read Article


