


Understanding Momentum Trading Strategies in Currency Markets
Exploring Currency Momentum Trading Strategies Momentum trading is a popular strategy utilized by traders in currency markets. It is based on the idea …
Read Article
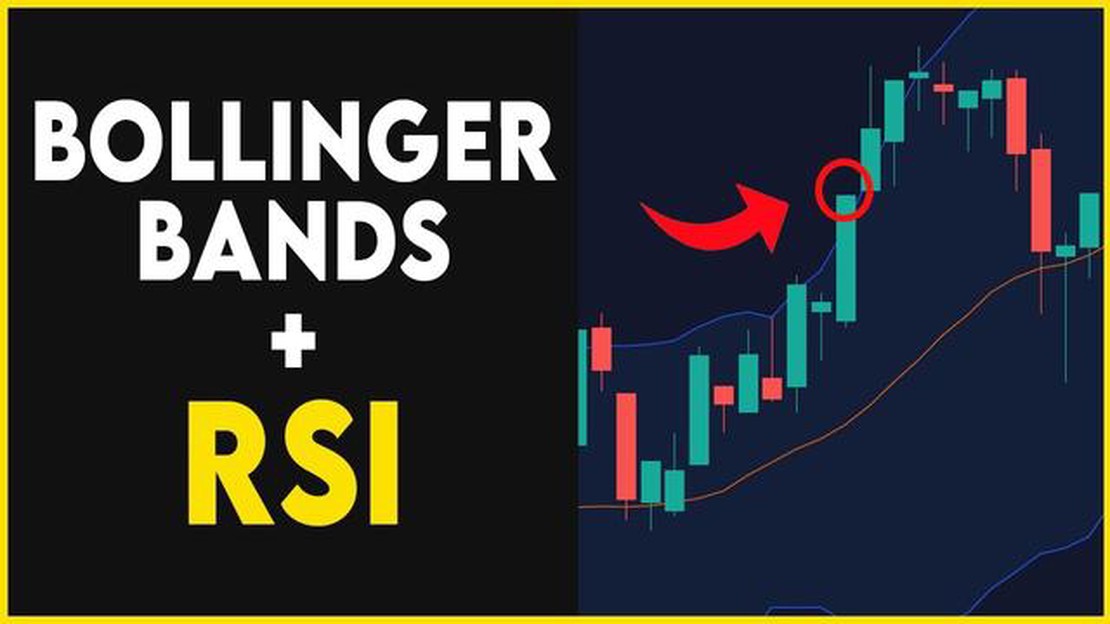
Bollinger Bands is a technical analysis tool developed by John Bollinger that provides valuable insights into market volatility and potential price reversals. By using a combination of a simple moving average and standard deviations, Bollinger Bands create a dynamic channel around the price chart. This channel helps traders to identify overbought and oversold conditions, as well as detect changes in market trends.
One important signal that Bollinger Bands provide is the Bollinger Bands Cross. This occurs when the price crosses above or below the upper or lower band, respectively. The cross signifies a potential change in the market direction and can be used as a signal to enter or exit a trade. However, it is crucial to understand and interpret the signals accurately for effective decision-making.
When the price crosses above the upper band, it indicates a potential overbought condition. This means that the price has moved significantly higher, and a reversal to the downside may be imminent. Traders can consider selling or placing short positions when this signal occurs. On the other hand, when the price crosses below the lower band, it suggests a potential oversold condition. In this case, the price has dropped significantly, and a reversal to the upside might be expected. Traders can consider buying or placing long positions when this signal is generated.
It is important to note that Bollinger Bands Cross signals should not be considered in isolation. Traders should always use additional technical indicators and analysis tools to confirm the signals and assess the overall market conditions. Additionally, risk management strategies should be implemented to control losses and protect profits. By understanding and interpreting Bollinger Bands Cross signals correctly, traders can improve their trading decisions and increase their chances of success in the market.
Bollinger Bands Cross is a technical analysis tool that is used to identify potential buy or sell signals. It involves the use of Bollinger Bands, which are a type of volatility indicator that consist of a Simple Moving Average (SMA) and an upper and lower band that represent the standard deviation of the price.
When the price crosses above the upper band, it is considered a potential sell signal, indicating that the market may be overbought. On the other hand, when the price crosses below the lower band, it is considered a potential buy signal, indicating that the market may be oversold.
However, it is important to note that Bollinger Bands Cross should not be used as a standalone indicator, but rather as a confirmation tool in conjunction with other technical analysis tools and indicators. It is also important to consider the overall trend of the market and other factors that may impact the price movement.
Traders often use Bollinger Bands Cross in combination with other technical indicators, such as trendlines, moving averages, and oscillators to further validate the signals and increase the probability of a successful trade. By combining multiple indicators, traders can gain more confidence in their trading decisions.

In conclusion, Bollinger Bands Cross is a popular technical analysis tool that can help traders identify potential buy or sell signals in the market. However, it is important to use it in conjunction with other indicators and consider the overall market conditions before making any trading decisions.
When analyzing financial market trends, Bollinger Bands are a popular technical analysis tool that can provide valuable insights. Bollinger Bands consist of a simple moving average line and two standard deviation lines, creating a channel around the price action. Traders often look for “Bollinger Bands Cross” signals to identify potential buying or selling opportunities.
There are two types of Bollinger Bands Cross signals that traders should pay attention to: the upper band cross and the lower band cross.
Upper Band Cross:
Read Also: The Ultimate Guide to Developing a Winning Futures Trading Strategy in India
When the price action crosses above the upper band, it suggests that the market is in an overbought condition. This means that the price has reached an extreme level and may be due for a reversal. Traders might consider selling or shorting the asset at this point.
Lower Band Cross:
When the price action crosses below the lower band, it indicates that the market is in an oversold condition. This means that the price has reached a significant low and may be ready for a bounce or a reversal. Traders might consider buying or longing the asset at this point.
It’s important to note that Bollinger Bands Cross signals should not be used as standalone indicators. They should be used in conjunction with other technical analysis tools and indicators to confirm the validity of the signals. Traders should also consider the overall market trend and other factors that may influence the price action.
Read Also: Best leverage options for trading with $3000
Another important aspect of interpreting Bollinger Bands Cross signals is the time frame used. Traders can adjust the time frame of the chart to match their trading style, whether it’s short-term scalping or long-term investing. Different time frames can provide different signals, so it’s crucial to choose the appropriate one for your strategy.
In conclusion, Bollinger Bands Cross signals can be a valuable tool for traders when used correctly. By understanding the signals and their implications, traders can make informed decisions and improve their chances of success in the financial markets.
| Signal | Description |
|---|---|
| Upper Band Cross | Price action crosses above the upper band, indicating an overbought condition and potential selling opportunity. |
| Lower Band Cross | Price action crosses below the lower band, indicating an oversold condition and potential buying opportunity. |
Bollinger Bands are a technical analysis tool that consists of a middle band (usually a 20-day simple moving average) and two outer bands that are standard deviations away from the middle band. They are used to measure volatility and identify potential price reversals.

Bollinger Bands are interpreted by looking for price action near the upper and lower bands. When the price reaches or crosses the upper band, it may be a sign of an overbought condition and a potential reversal to the downside. Conversely, when the price reaches or crosses the lower band, it may be a sign of an oversold condition and a potential reversal to the upside.
A Bollinger Bands cross occurs when the price moves from one band to the other. For example, if the price moves from below the lower band to above the upper band, it is considered a bullish cross signal. Conversely, if the price moves from above the upper band to below the lower band, it is considered a bearish cross signal.
Bollinger Bands crosses can be used as signals to enter or exit trades. When a bullish cross occurs, it may be a signal to buy or go long. When a bearish cross occurs, it may be a signal to sell or go short. Traders can also use Bollinger Band crosses in conjunction with other technical indicators for confirmation.
No, Bollinger Bands crosses are not always reliable indicators. They should be used in conjunction with other technical analysis tools and indicators to confirm signals. Traders should also consider other factors such as market conditions, news events, and overall trend before making trading decisions based on Bollinger Bands crosses.
Bollinger Bands are a technical analysis tool that consists of a moving average and a band above and below it. The bands are based on standard deviations from the moving average. They are used to measure volatility and identify potential price reversals.
When the price is trading near the upper band, it suggests that the market is overbought and the price may soon reverse. Conversely, when the price is near the lower band, it indicates that the market is oversold and the price may soon bounce back. Additionally, when the bands start to squeeze together, it suggests that a significant price move is imminent.

Exploring Currency Momentum Trading Strategies Momentum trading is a popular strategy utilized by traders in currency markets. It is based on the idea …
Read Article
How to Transfer Money from India to USA through SBI Transferring money internationally can be a complex and daunting process, especially when it …
Read Article
Trading Forex in Canada as an International Student: What You Need to Know Foreign exchange, or forex, trading can be an exciting way for …
Read Article
Stocks Drop on 9/11: How Much Did They Fall? On September 11, 2001, the United States experienced one of the most devastating terrorist attacks in …
Read Article
Benefits of Investing in Forex Trading Forex trading, also known as foreign exchange trading, is becoming increasingly popular among investors. With …
Read Article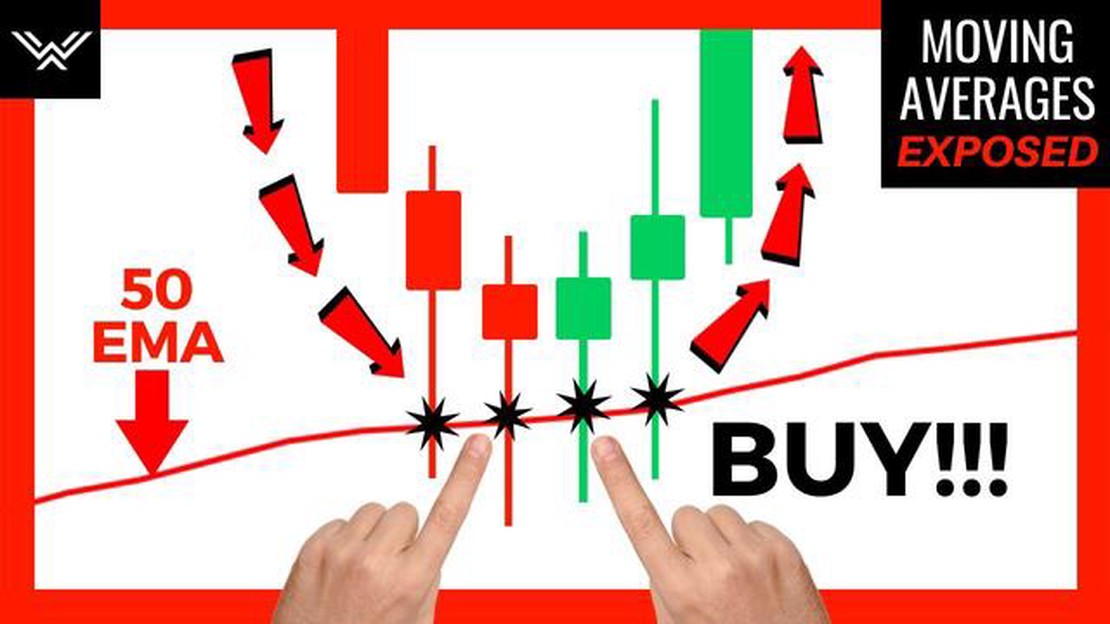
What is the best EMA length for trend? Trend trading is a popular strategy among traders and investors who aim to capture the momentum of a market …
Read Article


