


Is Binary Options Trading Legal in India? | Everything You Need to Know
Is binary options trading legal in India? Binary options trading is a popular investment option in many countries around the world. However, in India, …
Read Article
When it comes to trading strategies, one method that has gained popularity among traders is the Bollinger Bands (BB) Width strategy. This strategy utilizes the concept of volatility to identify potential trading opportunities. By understanding how this strategy works and implementing it effectively, traders can improve their chances of success in the financial markets.
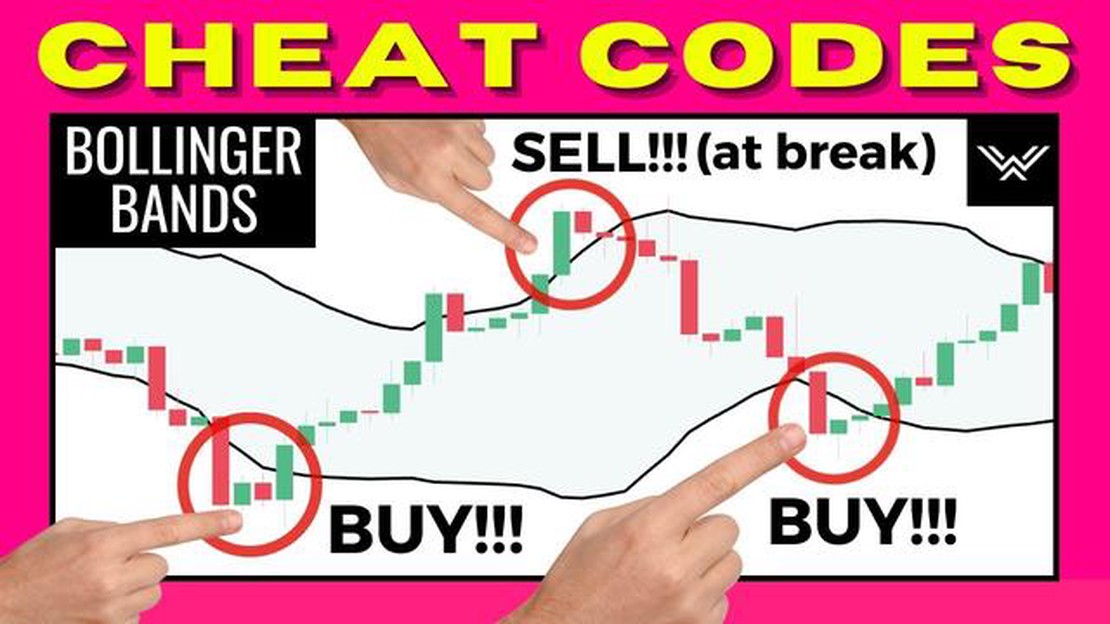
The Bollinger Bands are a technical analysis tool that consists of a set of three lines plotted on a price chart. The middle line represents the average price over a specified period, while the upper and lower lines represent the standard deviations from the average. The width of the Bollinger Bands is a measure of volatility, indicating the range in which prices are likely to fluctuate.
The BB Width strategy involves monitoring the width of the Bollinger Bands to assess market conditions. When the bands are narrow, it suggests low volatility and a potential consolidation period. Conversely, when the bands are wide, it indicates high volatility and the possibility of a price breakout. Traders can use this information to make informed decisions about entering or exiting trades.
To implement the BB Width strategy effectively, traders need to consider several factors. First, they should determine the appropriate period and standard deviation settings for the Bollinger Bands based on the specific asset and time frame being traded. Additionally, traders should use other technical indicators and chart patterns to confirm trading signals generated by the BB Width strategy.
Successful implementation of the BB Width strategy requires discipline and risk management. Traders should establish clear entry and exit rules and stick to them, avoiding emotional decision-making. It is also essential to use appropriate position sizing and stop-loss orders to manage risk effectively.
In conclusion, understanding and implementing the BB Width strategy can be a valuable tool in a trader’s arsenal. By analyzing the width of the Bollinger Bands and considering other technical indicators, traders can identify potential trading opportunities and manage risk more effectively. However, it is important to remember that no strategy guarantees success in the financial markets, and traders should always exercise caution and practice proper risk management.
The BB Width Strategy, also known as the Bollinger Bands Width Strategy, is a popular trading strategy that is based on the Bollinger Bands indicator. The Bollinger Bands indicator is a volatility indicator that consists of a simple moving average (SMA) in the middle and two standard deviations above and below the SMA, forming a channel.

The BB Width Strategy focuses on the width of the Bollinger Bands channel. When the Bollinger Bands are close together, it indicates that the market is experiencing low volatility. Conversely, when the Bollinger Bands are wide apart, it indicates high volatility in the market. This width is calculated by taking the difference between the upper and lower bands and dividing it by the middle band.
The BB Width Strategy involves monitoring the BB Width to identify periods of low volatility and high volatility. During periods of low volatility, traders can expect a potential breakout or a reversal in price, as it suggests that the market is consolidating. Conversely, during periods of high volatility, traders can expect the continuation of a trend or a sharp price movement, as it suggests that the market is experiencing strong momentum.
To implement the BB Width Strategy, traders can use the BB Width as a standalone indicator or in combination with other technical indicators. Some common trading signals generated by the BB Width Strategy include:
It is important for traders to note that the BB Width Strategy is not a foolproof strategy and should be used in conjunction with sound risk management practices. Like any trading strategy, it is also important to backtest and validate the strategy before implementing it in live trading.
Read Also: Is Trading a Better Investment Option than Stocks? - Find out the Pros and Cons of Both
In conclusion, the BB Width Strategy is a popular trading strategy that focuses on the width of the Bollinger Bands channel. By monitoring the BB Width, traders can identify periods of low volatility and high volatility in the market, which can provide valuable trading signals. However, it is important to use the strategy in conjunction with other technical indicators and practice proper risk management.
The Bollinger Bands (BB) Width strategy is a popular technical analysis tool used by traders to identify potential trading opportunities. The strategy is based on the concept of volatility, which refers to the degree of price fluctuation in a financial instrument. By measuring the width of the Bollinger Bands, traders can assess the current market volatility and potentially identify periods of price expansion or contraction.
Read Also: Understanding the Boeing Stock Plan: Everything You Need to Know
The Bollinger Bands consist of three lines: the middle band, which is a simple moving average, and the upper and lower bands, which are standard deviations away from the middle band. The middle band represents the average price over a specific period, while the upper and lower bands are a measure of volatility. The width of the BB is calculated by subtracting the lower band from the upper band.
Traders often use the BB Width strategy to identify periods of low volatility, which can indicate an impending price breakout. When the BB Width is narrow, it suggests that the market is experiencing a period of consolidation, with limited price movement. In contrast, a wide BB Width indicates high volatility, with potential for larger price moves.
One common approach is to wait for the BB Width to contract to a historically low level before considering a potential trade. This is because periods of low volatility are often followed by periods of high volatility. Once the BB Width starts to expand, traders may look for a price breakout in the direction of the trend.
Another approach is to use the BB Width as a confirmation tool for other trading signals. For example, if a trader identifies a bullish or bearish candlestick pattern, they may wait for the BB Width to confirm the signal by expanding or contracting accordingly.

It’s important to note that the BB Width strategy is not foolproof and should be used in conjunction with other technical analysis tools and risk management techniques. Traders should also consider the timeframe they are trading on, as the BB Width may vary on different timeframes.
In conclusion, the BB Width strategy is a valuable tool for traders seeking to identify potential trading opportunities based on market volatility. By understanding the basics of the strategy and considering other technical analysis tools, traders can increase their chances of making informed trading decisions.
The BB Width strategy is a trading strategy based on the Bollinger Bands indicator. It involves using the width of the Bollinger Bands to identify whether the market is in a consolidation phase or a trending phase.
The BB Width is calculated by taking the difference between the upper and lower Bollinger Bands and dividing it by the middle Bollinger Band.
When the BB Width is low, it suggests that the market is in a consolidation phase and there is low volatility. Traders can use this information to look for trading opportunities that take advantage of range-bound market conditions.
Yes, the BB Width strategy can be used for all types of markets, including stocks, forex, and commodities. However, it is important to adapt the strategy to the specific market conditions and make adjustments as needed.

Is binary options trading legal in India? Binary options trading is a popular investment option in many countries around the world. However, in India, …
Read Article
Understanding Unrealized Profit and Loss Unrealized Profit and Loss, often referred to as Unrealized P&L, is a concept widely used in finance and …
Read Article
International ATM Guide: Which ATM Can I Use Abroad? When traveling abroad, it’s important to have access to cash in the local currency. One …
Read Article
Factors influencing the value of EUR The euro (EUR) is the currency used by most European Union (EU) member states. As one of the most widely traded …
Read Article
Exploring the Moving Average Valuation Method The moving average valuation method is a popular financial tool used in the analysis and forecasting of …
Read Article
Trading Hours on eToro: What times can you trade? When it comes to trading on eToro, it’s important to know the trading hours so you can make informed …
Read Article


