


Accelerated Stock Vesting: Understanding the Basics and Benefits
Accelerated Stock Vesting: Exploring the Benefits and Risks Accelerated stock vesting is a term that refers to the expedited process of gaining full …
Read Article
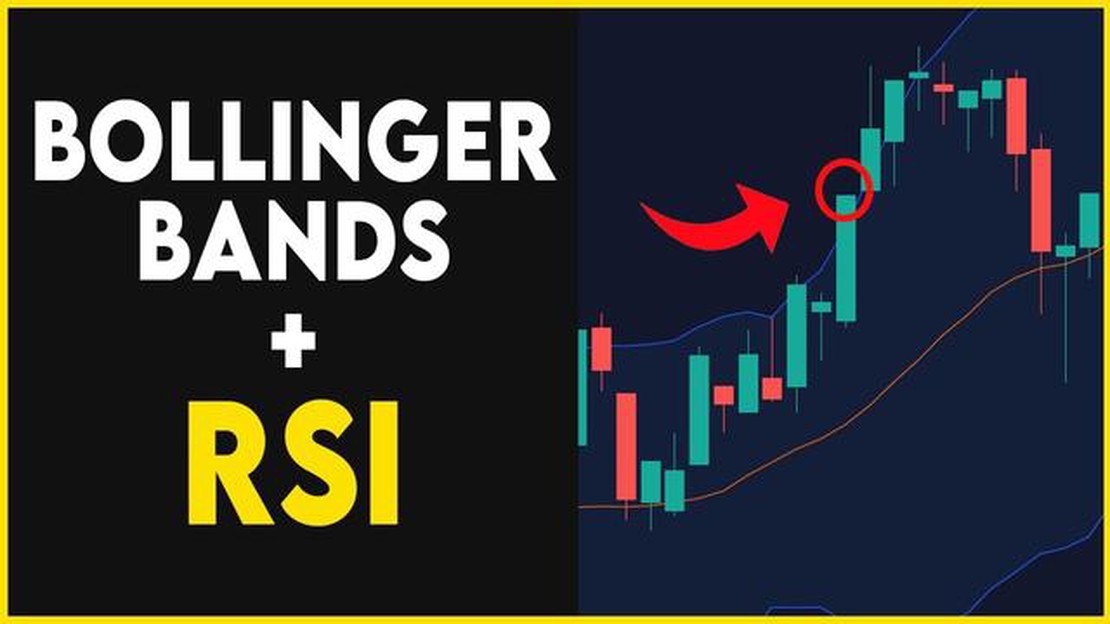
Bollinger Bands are a popular technical analysis tool that can help traders identify potential breakouts and trends in the financial markets. Developed by John Bollinger in the 1980s, Bollinger Bands consist of a moving average line and two outer bands that are plotted above and below the moving average line. The width of the bands is determined by the volatility of the price.
While Bollinger Bands are effective on their own, they can be even more powerful when paired with other indicators. The right combination of indicators can provide traders with additional confirmation and insight into market trends and potential reversals.
One of the best indicators to pair with Bollinger Bands is the Relative Strength Index (RSI). The RSI is a momentum oscillator that measures the speed and change of price movements. It ranges from 0 to 100 and is typically used to identify overbought and oversold conditions in a market.
When combining Bollinger Bands with the RSI, traders can look for confirmation of breakouts or reversals. For example, if the price of an asset breaks above the upper band of the Bollinger Bands and the RSI is also above a certain threshold, it could signal a strong bullish momentum. Conversely, if the price breaks below the lower band and the RSI is below a certain threshold, it could indicate a strong bearish momentum.
In conclusion, pairing Bollinger Bands with the Relative Strength Index can enhance a trader’s ability to identify and confirm potential trading opportunities. This combination of indicators can provide valuable insights into market trends and help traders make more informed trading decisions.
Bollinger Bands have become a popular technical analysis tool among traders and investors. This indicator, developed by John Bollinger in the 1980s, consists of a moving average line along with an upper and lower band that represents the standard deviation of the price movement. The advantage of using Bollinger Bands lies in its ability to provide valuable insights into price volatility and potential reversals.
One of the key advantages of Bollinger Bands is their ability to adapt to changing market conditions. The width of the bands expands and contracts based on market volatility, which helps traders gauge how much the price is likely to move. When the bands are wide, it indicates high volatility, and when they are narrow, it suggests low volatility.
Another advantage of Bollinger Bands is that they can help identify potential price reversals. When the price touches or moves beyond the upper or lower band, it is considered an overbought or oversold condition, respectively. This can signal that the price is likely to reverse direction, providing traders with potential trading opportunities.

Furthermore, Bollinger Bands can be used in conjunction with other technical indicators to enhance trading strategies. For example, combining Bollinger Bands with a momentum oscillator, such as the Relative Strength Index (RSI), can help confirm potential trend reversals. By using multiple indicators, traders can increase the probability of making profitable trades.
Bollinger Bands can also be helpful for setting stop-loss levels. By placing a stop-loss order beyond the upper or lower band, traders can protect themselves from excessive losses if the price continues to move in the unfavorable direction.
| Advantages of Using Bollinger Bands |
|---|
| Adapts to changing market conditions |
| Provides insights into price volatility |
| Identifies potential price reversals |
| Enhances trading strategies when combined with other indicators |
| Helps in setting stop-loss levels |
In conclusion, Bollinger Bands offer several advantages for traders and investors. By providing insights into price volatility, identifying potential price reversals, and enhancing trading strategies, they can be a valuable tool in technical analysis. When used in conjunction with other indicators, traders can increase their chances of making informed trading decisions.
Read Also: How to Easily Calculate the Value of a Stock: Step-by-Step Guide
Bollinger Bands are a technical analysis tool that was created by John Bollinger in the 1980s. They consist of a moving average line (typically a 20-day moving average) and two standard deviation lines that are plotted above and below the moving average.
The purpose of Bollinger Bands is to provide traders with a visual representation of price volatility. The width between the upper and lower bands expands and contracts based on market conditions, indicating periods of high and low volatility.
Read Also: The Advantages and Disadvantages of Stock Warrants: A Comprehensive Review
When the price is trading near the upper band, it is considered overbought, indicating a potential reversal or pullback in price. Conversely, when the price is trading near the lower band, it is considered oversold, indicating a potential reversal or bounce in price.
In addition to identifying overbought and oversold conditions, Bollinger Bands can also be used to identify potential trend reversals. When the price breaks above the upper band, it may indicate a bullish reversal. Conversely, when the price breaks below the lower band, it may indicate a bearish reversal.
Traders can also use Bollinger Bands to identify price patterns, such as squeeze patterns. A squeeze pattern occurs when the upper and lower bands are close together, indicating low volatility. When volatility expands, it may signal a potential breakout in price.
Overall, Bollinger Bands are a versatile and widely used technical analysis tool that can help traders identify potential trading opportunities based on price volatility and trend reversals.

Bollinger Bands are a technical analysis tool that consists of a moving average line and two standard deviation lines placed above and below it. They are used to measure the volatility and potential price levels of a financial instrument.
Bollinger Bands can be used in trading to identify potential price levels and to gauge the volatility of a financial instrument. Traders can use the upper and lower bands as price targets or as potential areas of support and resistance. Additionally, the width of the bands can be used to determine the strength of a trend.
The best indicator to pair with Bollinger Bands depends on the specific trading strategy and the goals of the trader. However, some commonly used indicators that can complement Bollinger Bands include the Relative Strength Index (RSI), the Moving Average Convergence Divergence (MACD), and the Stochastic Oscillator.
The Relative Strength Index (RSI) can be used with Bollinger Bands to confirm potential overbought or oversold conditions. When the price touches or exceeds the upper Bollinger Band and the RSI is above a certain threshold, it could indicate that the instrument is overbought and due for a reversal. Conversely, when the price touches or falls below the lower Bollinger Band and the RSI is below a certain threshold, it could indicate that the instrument is oversold and due for a reversal.
The Moving Average Convergence Divergence (MACD) is a trend-following momentum indicator that consists of two lines: the MACD line and the signal line. It can be used with Bollinger Bands to confirm potential trend reversals. When the MACD line crosses above the signal line while the price is touching or exceeding the upper Bollinger Band, it could indicate a potential downtrend reversal. Conversely, when the MACD line crosses below the signal line while the price is touching or falling below the lower Bollinger Band, it could indicate a potential uptrend reversal.
Bollinger Bands are a technical analysis tool created by John Bollinger. They consist of a moving average line in the middle, with an upper band and a lower band that are two standard deviations away from the moving average. Bollinger Bands help traders analyze volatility and identify potential overbought or oversold conditions.
Bollinger Bands can be used in various ways in trading. One common strategy is to buy when the price of an asset touches the lower band and sell when it reaches the upper band. Another approach is to look for price breakouts outside the bands, signaling potential strong trends. Traders also use the width of the bands as an indicator of volatility, with wider bands suggesting higher volatility levels.

Accelerated Stock Vesting: Exploring the Benefits and Risks Accelerated stock vesting is a term that refers to the expedited process of gaining full …
Read Article
Should You Buy, Sell, or Hold BAC Stock? If you’re considering investing in Bank of America (BAC) or already have a position, you may be wondering …
Read Article
Best Places to Exchange Euros into Australian Dollars When traveling to Australia from Europe, one of the first things you will need to consider is …
Read Article
Trading Currency on NSE: Everything You Need to Know Trading currency on the National Stock Exchange (NSE) is an exciting and potentially lucrative …
Read Article
Factors that Drive Market Volatility Market volatility refers to the rapid and significant price fluctuations of financial assets within a given …
Read Article
Why MetaTrader 4 is Superior to MetaTrader 5 MetaTrader 4 (MT4) and MetaTrader 5 (MT5) are two popular trading platforms used by forex traders. While …
Read Article


