

Can You Trade Forex 24 Hours a Day in India? Exploring the Forex Market in India
Can you trade forex 24 hours a day in India? The forex market is a global marketplace where currencies are exchanged. It operates 24 hours a day, five …
Read Article
The simple moving average (SMA) is a commonly used technical analysis indicator that helps traders and investors analyze trends and make informed decisions. It is a calculation that averages the closing prices of a security or asset over a specific period of time, giving equal weight to each price point.
To calculate the simple moving average, you need to select a specific time period and sum up the closing prices for that period. Then, divide the sum by the number of periods. This will give you the average for that time period. As new prices become available, the oldest price is dropped and the newest is added, resulting in a smoother line that reflects the average price over time.
Let’s look at an example to understand how the simple moving average calculation works. Suppose you want to calculate the 10-day SMA for a stock. You would need the closing prices for the last 10 days. Let’s say the closing prices are as follows:
Day 1: $50
Day 2: $55
Day 3: $60
Day 4: $58
Day 5: $62
Day 6: $65
Day 7: $70
Day 8: $68
Day 9: $72
Day 10: $75
To calculate the SMA, you would sum up these closing prices: $50 + $55 + $60 + $58 + $62 + $65 + $70 + $68 + $72 + $75 = $675. Then, divide the sum by the number of periods (10) to get the average: $675 / 10 = $67.50. Therefore, the 10-day SMA for this stock is $67.50.
The SMA is a useful tool for identifying trends and potential buying or selling opportunities. Traders often use multiple SMAs with different time periods to get a clearer picture of the price trend. By comparing the short-term SMA with the long-term SMA, traders can identify potential trend reversals and make more accurate trading decisions.
Calculating the simple moving average (SMA) is a straightforward process that can be performed using a few simple steps. The SMA is a widely used technical indicator that helps traders and investors identify trends and potential reversals in the market.
To calculate the SMA, follow these steps:
Step 1: Determine the time period for the moving average. This could be a short-term period, such as 10 days, or a longer-term period, such as 50 days.
Step 2: Collect the data points for the desired time period. This could be the closing prices of a stock or any other financial instrument.
Step 3: Add up all the data points for the time period.
Step 4: Divide the sum by the number of data points to calculate the simple moving average.
Step 5: Repeat the process for each subsequent time period to update the SMA.
For example, let’s calculate the 10-day SMA of a stock’s closing prices:
Day 1: $50

Day 2: $55
Read Also: How many lots can you trade with $1000 in forex?
Day 3: $52
Day 4: $48
Day 5: $53
Day 6: $58
Day 7: $54
Day 8: $57
Day 9: $61
Day 10: $59
Read Also: Understanding Currency Pairs: A Beginner's Guide
To calculate the 10-day SMA, we add up the closing prices for the 10 days: $50 + $55 + $52 + $48 + $53 + $58 + $54 + $57 + $61 + $59 = $547. Then, we divide the sum by 10 to get the SMA: $547 / 10 = $54.70.

The 10-day SMA can be plotted on a chart to visualize the trend of the stock’s closing prices over time. Traders and investors often use the SMA in combination with other technical indicators to make informed decisions about buying or selling a security.
By following these steps, you can easily calculate the simple moving average and use it as a tool in your trading and investing strategies.
The Simple Moving Average (SMA) is a commonly used technical indicator in financial analysis. It is a calculation that helps traders and investors understand the overall trend of an asset price over a certain period of time.
The SMA is calculated by adding up the closing prices of the asset over a specified period of time and then dividing the sum by the number of periods. The resulting value is the average price over that time period.
For example, suppose we want to calculate the 5-day SMA of a stock. We would add up the closing prices of the stock over the past 5 days and then divide the sum by 5. This would give us the average price of the stock over that 5-day period.
The SMA is often used to smooth out fluctuations in price and identify trends. By looking at the SMA over different time periods, traders can get an idea of whether the price is trending upwards, downwards, or moving sideways.
Traders often use the SMA as a basis for making trading decisions. For example, if the price of a stock crosses above its 50-day SMA, it may be seen as a bullish signal, indicating that the stock price may continue to rise. On the other hand, if the price crosses below its 50-day SMA, it may be seen as a bearish signal, indicating that the stock price may continue to fall.
The SMA can also be used in combination with other technical indicators to generate trading signals. For example, some traders may look for a crossover of two SMA lines, such as the 10-day SMA and the 50-day SMA, to generate buy or sell signals.
It’s important to note that the SMA is a lagging indicator, meaning that it is based on historical price data and may not always accurately predict future price movements. However, it is still a useful tool for understanding the overall trend of an asset and can be a valuable tool in a trader’s toolkit.
| Period | Closing Prices | Simple Moving Average |
|---|---|---|
| 1 | 10 | - |
| 2 | 15 | - |
| 3 | 12 | - |
| 4 | 18 | - |
| 5 | 20 | - |
The Simple Moving Average (SMA) calculation method is a popular technique used in financial analysis to identify trends and patterns in data. It is commonly used to smooth out market fluctuations and provide insights into a security’s price movement over a specific period of time.
To calculate the SMA, you need to sum up the closing prices of a security over a specified number of periods and divide it by the number of periods. The result represents the average price of the security over that period.
Here is a step-by-step guide on how to calculate the SMA:
For example, let’s say you want to calculate the 10-day moving average of a stock’s closing prices:
The resulting average price can be plotted on a chart to visualize the trend and help identify support and resistance levels. Traders and investors use the SMA as a tool to make informed decisions about buying or selling a security.
It’s worth noting that the SMA is a lagging indicator, meaning it provides information about past price movements rather than predicting future price movements. Therefore, it is often used in conjunction with other technical analysis tools to confirm signals and make more accurate predictions.
In conclusion, the Simple Moving Average calculation method is a useful tool in financial analysis for analyzing trends and patterns in data. By calculating the average price over a specified period, it helps traders and investors make informed decisions about buying or selling securities.
A Simple Moving Average is a calculation used to analyze data points by creating a series of averages of different subsets of the full data set.
A Simple Moving Average is calculated by taking the sum of a set number of data points and dividing it by the total number of data points in the set.
A Simple Moving Average is useful because it helps to smooth out fluctuations in data and highlight long-term trends.
Yes, an example of calculating a Simple Moving Average would be taking the closing prices of a stock over a 10-day period, summing them up, and dividing by 10 to get the average.
Yes, one limitation of using a Simple Moving Average is that it may lag behind current data points, as it is based on historical data. Additionally, it may not accurately reflect sudden changes in the data set.
A simple moving average is a statistical calculation used to analyze data points over a certain period of time. It is used to smooth out fluctuation in data and identify trends.

Can you trade forex 24 hours a day in India? The forex market is a global marketplace where currencies are exchanged. It operates 24 hours a day, five …
Read Article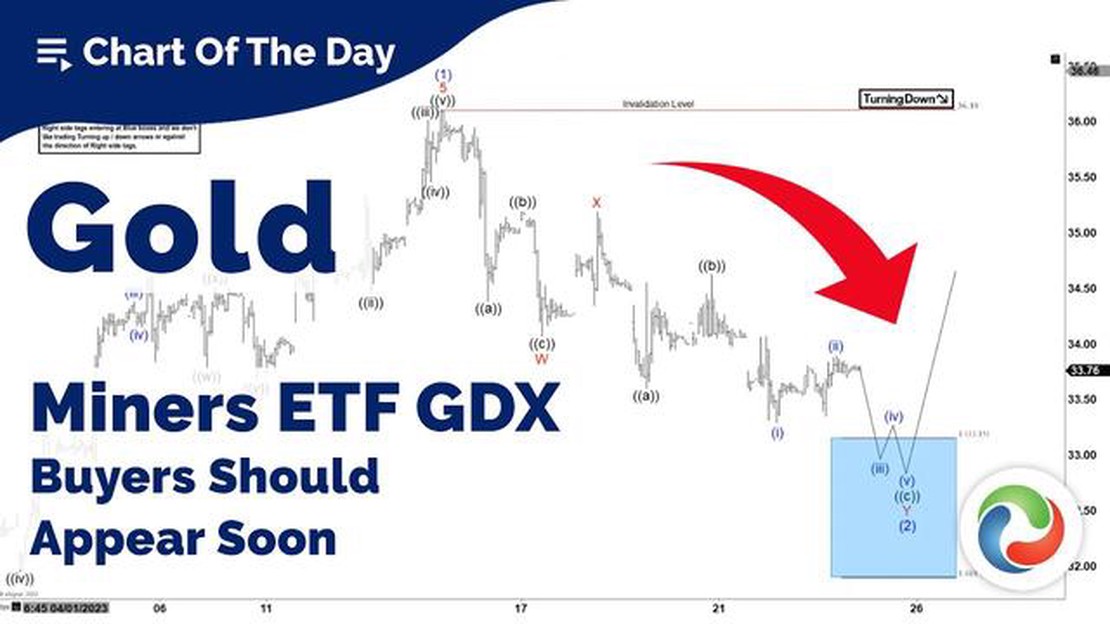
Is GDX a good buy now? When it comes to investing, it’s crucial to carefully consider your options and assess the potential of different assets. One …
Read Article
Is China a $20 trillion dollar economy? China has long been regarded as one of the world’s fastest-growing economies, but is it really worth $20 …
Read Article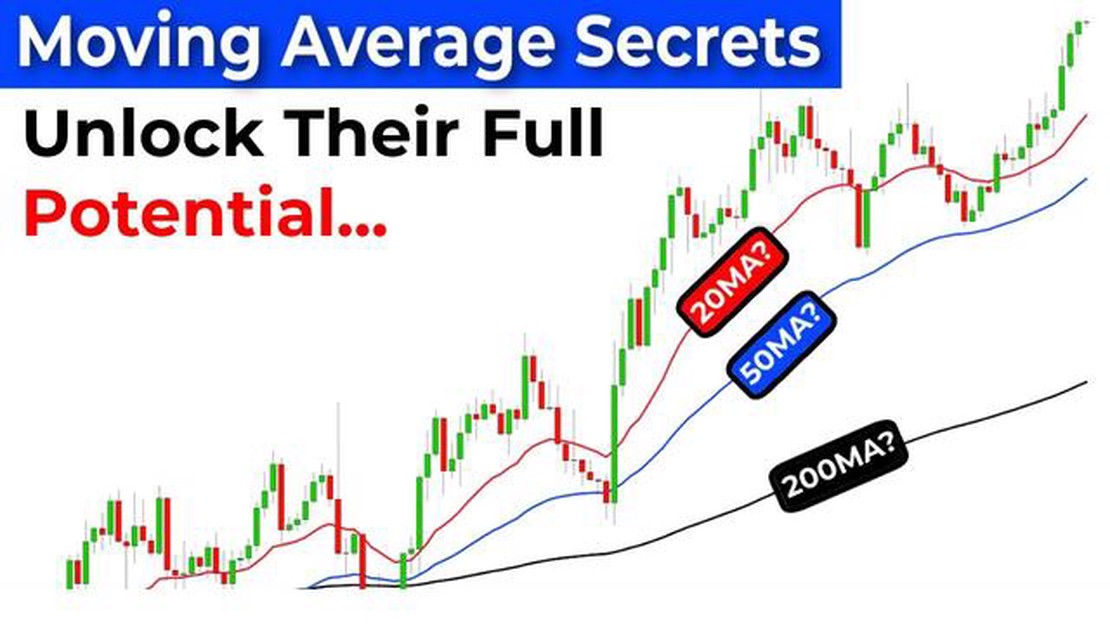
Guide to Calculating EMA 10 If you’re interested in trading and investing, understanding technical analysis is essential. One popular indicator that …
Read Article
Understanding the Forex market through Slideshare If you have ever wondered how the forex market works, you’re not alone. With trillions of dollars …
Read Article
What is the rule of 3 in hematology? Hematology is a branch of medicine that focuses on studying blood and its diseases. It plays a critical role in …
Read Article


