


Average Return on Selling Options: What You Need to Know
What is the average return on selling options? Options trading can be a lucrative investment strategy. One common approach is to sell options to …
Read Article
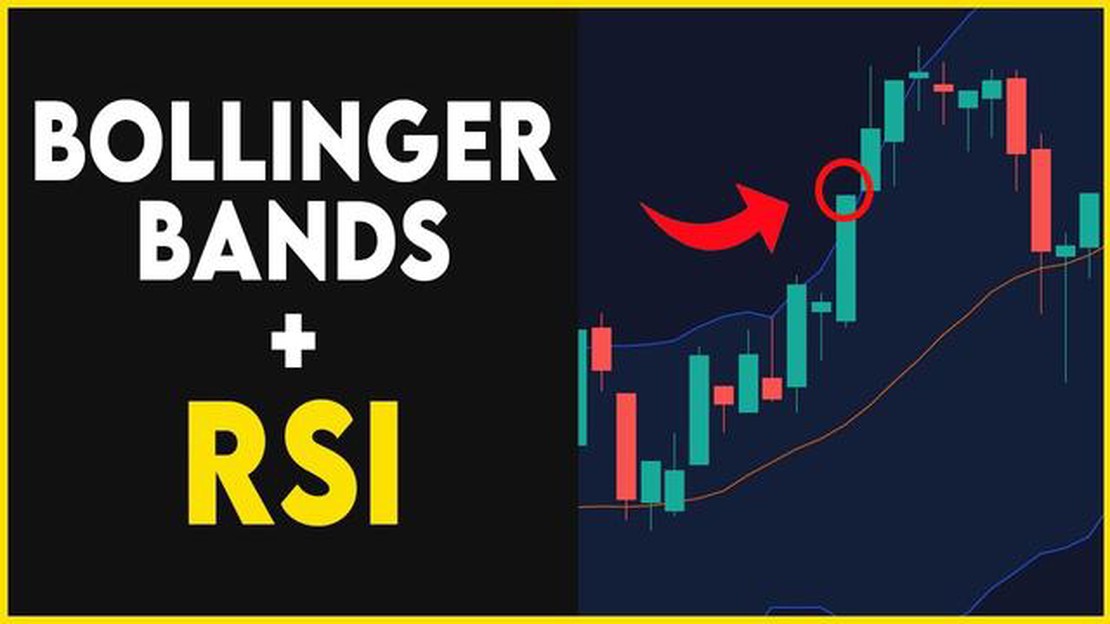
When it comes to technical analysis, two popular tools that traders often rely on are the Relative Strength Index (RSI) and Bollinger Bands. These indicators provide valuable insights into market trends, momentum, and potential trading opportunities. However, understanding how to read and interpret them is crucial for successful trading.
The RSI is a momentum oscillator that measures the speed and change of price movements. It oscillates between 0 and 100 and is typically used to identify overbought and oversold conditions in the market. Traders often look for divergences between the RSI and price to predict trend reversals or confirm the strength of an existing trend.
Bollinger Bands, on the other hand, are a volatility indicator that consists of a centerline and two standard deviation bands. The centerline represents the simple moving average, while the bands are positioned at a specified number of standard deviations above and below the average. Bollinger Bands expand and contract with market volatility, making them useful for identifying periods of consolidation and potential breakouts.
By mastering the RSI and Bollinger Bands, traders can gain valuable insights into market conditions and make more informed trading decisions. In this comprehensive guide, we will explore how to effectively read and interpret these indicators, including key strategies and best practices. Whether you are a beginner or an experienced trader, understanding these essential tools will enhance your ability to navigate the financial markets with confidence.
“By mastering the RSI and Bollinger Bands, traders can gain valuable insights into market conditions and make more informed trading decisions.”
The Relative Strength Index (RSI) and Bollinger Bands are popular technical indicators used by traders to analyze the price movement of a security. These indicators provide valuable insights into the market conditions and help traders make informed trading decisions.
The RSI is a momentum oscillator that measures the speed and change of price movements. It is a range-bound indicator, meaning it fluctuates between 0 and 100. The RSI is based on the concept that prices tend to close higher during periods of strength and lower during periods of weakness.
Traders use the RSI to identify overbought and oversold conditions in a security. When the RSI is above 70, it indicates that the security is overbought and may be due for a price correction. Conversely, when the RSI is below 30, it suggests that the security is oversold and may be due for a price rebound.
Bollinger Bands, on the other hand, are volatility bands that consist of a simple moving average (SMA) and two standard deviation bands. The middle band is the SMA, while the upper and lower bands measure the volatility of the security. The width of the bands expands and contracts as volatility increases or decreases.

Traders use Bollinger Bands to identify periods of low volatility followed by periods of high volatility. When the bands are narrow, it suggests that the security is experiencing low volatility and may be due for a breakout. Conversely, when the bands are wide, it indicates that the security is experiencing high volatility.
By combining the RSI and Bollinger Bands, traders can gain a more comprehensive understanding of the market conditions. For example, if the RSI indicates that a security is overbought and the Bollinger Bands are narrow, it suggests that the security may be due for a price correction followed by increased volatility.
Read Also: Is Psychology Important in Forex Trading? How it Affects Your Trading Performance
It is important for traders to use these indicators in conjunction with other forms of analysis to validate their trading decisions. The RSI and Bollinger Bands are just tools that provide insights into the market conditions, and traders should consider other factors such as trend analysis, support and resistance levels, and fundamental analysis before entering or exiting a trade.
In conclusion, the RSI and Bollinger Bands are powerful technical indicators that can help traders identify overbought and oversold conditions, as well as periods of low and high volatility. By understanding how these indicators work and using them in combination with other forms of analysis, traders can make more informed trading decisions.
RSI, which stands for Relative Strength Index, is a technical indicator used in trading to measure the strength and speed of price movements. It was developed by J. Welles Wilder Jr. in 1978 and has since become one of the most widely used oscillators in technical analysis.
The RSI is a momentum oscillator that ranges from 0 to 100. It compares the magnitude of recent gains to recent losses to determine whether an asset is overbought or oversold. The RSI is plotted as a single line that fluctuates between these extremes, indicating potential price reversals and trend strength.
The formula for calculating RSI involves comparing the average of the most recent up periods with the average of the most recent down periods. This calculation results in a value between 0 and 100, with values above 70 generally indicating overbought conditions and values below 30 indicating oversold conditions.
Traders commonly use the RSI to identify divergences, which occur when the price of an asset is moving in the opposite direction of the RSI. Divergences can signal potential trend reversals and provide valuable trading opportunities.
Read Also: What is the value of a micro lot in forex trading?
Moreover, the RSI can also be used to determine the strength of a trend. When the RSI is trending higher while the price is making higher highs and higher lows, it suggests a strong uptrend. Conversely, when the RSI is trending lower while the price is making lower highs and lower lows, it suggests a strong downtrend.
It’s important to note that no single indicator can provide a definitive prediction of future price movements. Traders often use the RSI in combination with other technical indicators or chart patterns to gain a more comprehensive understanding of the market conditions.

In conclusion, the RSI is a popular and versatile technical indicator that can help traders identify potential price reversals and trend strength. While it has its limitations, when used in combination with other tools, it can be a valuable tool in a trader’s toolkit.
RSI stands for Relative Strength Index and it is a technical indicator used in financial markets to measure the speed and change of price movements. It is a momentum oscillator that ranges from 0 to 100 and is typically used to determine overbought and oversold conditions.
RSI is calculated using a formula that takes into account the average gain and average loss over a certain period of time. The formula is: RSI = 100 - (100 / (1 + RS)), where RS is the average gain divided by the average loss.
Bollinger Bands are a technical analysis tool that consists of a middle band, an upper band, and a lower band. The middle band is a simple moving average, while the upper and lower bands are calculated based on the standard deviation of price.
RSI and Bollinger Bands can be used together to provide confirmation signals for trading decisions. For example, if the RSI is indicating an overbought condition and the price is touching the upper band of the Bollinger Bands, it can be seen as a signal to sell.
Common interpretations of RSI include looking for overbought and oversold conditions, as well as divergences between price and the RSI. Bollinger Bands are often used to identify volatility and potential support and resistance levels.
RSI, or Relative Strength Index, is a technical indicator used in financial markets to determine whether an asset is overbought or oversold. Bollinger Bands, on the other hand, are a volatility indicator that displays a band around a moving average to measure the price volatility of an asset.

What is the average return on selling options? Options trading can be a lucrative investment strategy. One common approach is to sell options to …
Read Article
How much is 100 USD in KS? When traveling or making international transactions, it is important to understand how much your currency is worth in …
Read Article
What is the tax rate for SPX? Investing in the Standard & Poor’s 500 Index (SPX) can be a profitable endeavor for many individuals and institutions. …
Read Article
What is P& When it comes to technology and computer science, the term “P&” is often mentioned. But what exactly is P&? In simple terms, it refers to a …
Read Article
Is it safe to keep over $500,000 in a brokerage account? When it comes to managing large sums of money, such as over $500,000, in a brokerage account, …
Read Article
How much is $1000 American Express? American Express is one of the leading financial services companies in the world. It offers a wide range of credit …
Read Article


