


BTX Trading: A Comprehensive Guide to Understanding BTX
What is BTX trading? BTX, also known as Blockchain Technology Exchange, is a revolutionary platform that allows users to trade and exchange …
Read Article

Are you new to trading and want to learn how to make profitable decisions in the financial markets? Look no further. In this in-depth guide, we will walk you through the ins and outs of trading with AO (Awesome Oscillator), a popular technical indicator used by many experienced traders.
AO is a versatile tool that can help you identify potential trend reversals, evaluate market momentum, and generate valuable trading signals. Whether you are interested in trading stocks, commodities, or currencies, understanding how to use AO effectively can greatly enhance your trading strategy.
In this guide, we will start by explaining the concept behind AO and its calculation formula. We will dive into its interpretation and explore various trading strategies you can implement using this indicator. Examples and real-world scenarios will be provided to help you grasp the key concepts and put them into practice.
Moreover, we will discuss the advantages and limitations of AO, as well as common mistakes to avoid. By the end of this guide, you will have a solid understanding of AO and the confidence to incorporate it into your trading routine. Whether you are a beginner or an experienced trader, mastering AO can be a valuable addition to your trading arsenal.
Disclaimer: Trading involves risk and may not be suitable for everyone. This guide is for educational purposes only and should not be considered as financial advice. Always do your own research and consult with a professional financial advisor before making any investment decisions.
The Awesome Oscillator (AO) is a technical indicator developed by Bill Williams. It is used to measure market momentum and determine the direction of a trend. The AO calculates the difference between a 34-period and a 5-period simple moving average (SMA) and plots the result as a histogram.
The AO is based on the principle that short-term momentum is a precursor to long-term momentum. When the AO crosses above the zero line, it indicates that short-term momentum is turning bullish and the market is likely to continue in an upward trend. Conversely, when the AO crosses below the zero line, it indicates that short-term momentum is turning bearish and the market is likely to continue in a downward trend.
The AO can be used in conjunction with other technical indicators to confirm the strength of a trend or identify potential trend reversals. Traders can also use the AO to identify divergences between the indicator and price, which can signal a potential trend reversal.
One of the key advantages of using the AO is its ability to filter out market noise and provide clear signals. By focusing on short-term momentum, traders can avoid getting caught up in short-term fluctuations and focus on the broader trend. This can help improve the accuracy of trading decisions and increase the profitability of trades.
Overall, the Awesome Oscillator is an important tool for traders as it can help identify market trends, confirm trend strength, and detect potential trend reversals. By incorporating the AO into their trading strategies, traders can make more informed decisions and increase their chances of success in the market.
The concept of AO (Awesome Oscillator) is a widely used technical indicator in financial trading. Developed by Bill Williams, it is designed to measure the market momentum and identify possible trading opportunities. AO essentially demonstrates the difference between a 34-period and a 5-period simple moving average on a chart.
The indicator is plotted as a histogram that oscillates around the zero line. When the histogram is above the zero line, it indicates that the short-term momentum is higher than the long-term momentum, suggesting that it might be a good time to enter a buy trade. Conversely, when the histogram is below the zero line, it suggests that the short-term momentum is lower than the long-term momentum, indicating a potential sell opportunity.
One of the key benefits of using AO as a trading tool is its ability to provide early signals of trend reversal or continuation. By analyzing the crossing points of the zero line, traders can potentially enter trades ahead of the crowd, improving their chances of profiting from price movements. Additionally, AO can also be used to confirm other technical indicators or patterns, enhancing the overall trading strategy.

Another advantage of AO is its simplicity. With only two moving averages and a histogram, the indicator can be easily understood by both novice and experienced traders. It doesn’t rely on complex calculations or mathematical models, making it accessible to anyone interested in trading.
When using AO, it is important to combine it with other technical analysis tools and indicators to improve the accuracy of trading signals. It is also crucial to continuously monitor the indicator’s performance and adjust the trading strategy accordingly. Remember that no indicator is foolproof, and it is wise to practice risk management and only trade with funds you can afford to lose.
Read Also: Understanding Option Call and Put: A Comprehensive Guide
In conclusion, mastering the concept and benefits of AO can significantly enhance your trading skills. Whether you are a beginner or an experienced trader, understanding how AO works and applying it to your trading strategy can potentially increase your profits and improve your overall success rate in the financial markets.
Using the Awesome Oscillator (AO) in your trading strategy can help you identify potential market trends and make informed trading decisions. Here is a step-by-step guide on how to use AO effectively:
Step 1: Understand the Basics of AO
Before using AO in your trading strategy, it’s essential to understand its fundamentals. AO is a technical indicator that measures the market momentum based on the difference between a 34-period and a 5-period simple moving average. A positive AO value indicates bullish momentum, while a negative value indicates bearish momentum.
Step 2: Identify Entry and Exit Points
Once you have a clear understanding of AO, you can use it to identify potential entry and exit points. The AO histogram displays bars above or below the zero line. When the bars change from red to green, it indicates a potential bullish signal, suggesting a buy entry point. Conversely, when the bars change from green to red, it indicates a potential bearish signal, suggesting a sell entry point.
Read Also: How to Change Your Name and Gender in CT: A Comprehensive Guide
Step 3: Confirm with Other Indicators
It is essential to consider other technical indicators and tools to confirm the signals provided by AO. For example, you can use trend lines, support and resistance levels, or other oscillators to strengthen your trading decisions. The convergence of multiple indicators can increase the probability of a successful trade.

Step 4: Set Stop-Loss and Take-Profit Levels
To manage your risk effectively, always set stop-loss and take-profit levels when using AO. These levels are determined based on your risk tolerance and trading strategy. Placing a stop-loss will protect you from significant losses in case the trade goes against you, while a take-profit level will help you secure profits when the trade moves in your favor.
Step 5: Practice and Monitor Results
Using AO effectively requires practice and refinement of your trading strategy. Monitor the outcomes of your trades and make adjustments as necessary. Keep a record of your trades and analyze them regularly to identify patterns and improve your trading skills.
Conclusion:
The Awesome Oscillator is a powerful tool that can enhance your trading strategy and help you make more informed decisions. By following this step-by-step guide, you can effectively integrate AO into your trading routine and improve your chances of success in the markets.
AO stands for Awesome Oscillator. It is a technical indicator that is used to measure market momentum. It calculates the difference between a 34-period and a 5-period simple moving average (SMA) on a bar chart. The AO indicator fluctuates above and below a zero line, indicating the momentum of the market. Positive values indicate bullish momentum, while negative values indicate bearish momentum.
The formula for calculating AO is the difference between a 34-period and a 5-period simple moving average: AO = SMA(5) - SMA(34). The simple moving average is calculated by summing up the closing prices of the selected period and dividing by the number of periods.
AO can be used to trade by identifying bullish and bearish momentum in the market. Traders can look for buy signals when the AO crosses above the zero line and sell signals when it crosses below the zero line. Additionally, they can use divergences between the AO and the price chart to identify potential trend reversals.
Yes, there are some limitations to using AO. Firstly, it is a lagging indicator, which means that it may not provide timely signals when the market changes direction. Secondly, it can generate false signals during periods of low volatility. Traders should use AO in conjunction with other technical indicators and perform thorough analysis before making trading decisions.
Yes, AO can be used in conjunction with other indicators to enhance trading strategies. Traders often combine AO with other momentum indicators, such as the Relative Strength Index (RSI) or Moving Average Convergence Divergence (MACD). By using multiple indicators, traders can get a more comprehensive view of market conditions and make more informed trading decisions.

What is BTX trading? BTX, also known as Blockchain Technology Exchange, is a revolutionary platform that allows users to trade and exchange …
Read Article
How to Enable Short Selling on IBKR Short selling is a popular strategy in the stock market where traders bet on the decline of a stock’s price. …
Read Article
Is it possible to start my own forex broker? Starting your own forex brokerage can be a challenging but rewarding endeavor. The forex market, with …
Read Article
Best Time to Trade Currency Pairs Trading in the foreign exchange market can be a highly profitable venture, but timing is crucial. Knowing the best …
Read Article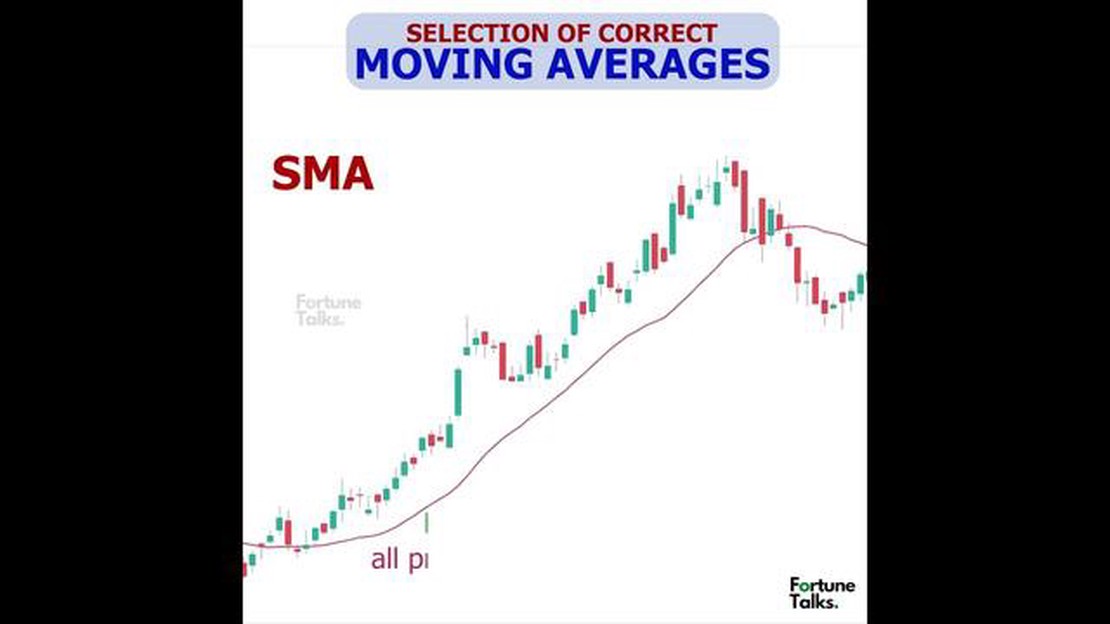
Is SMA the same as DMA? SMA and DMA are two commonly used acronyms in the world of finance and investment. While they sound similar and may be used …
Read Article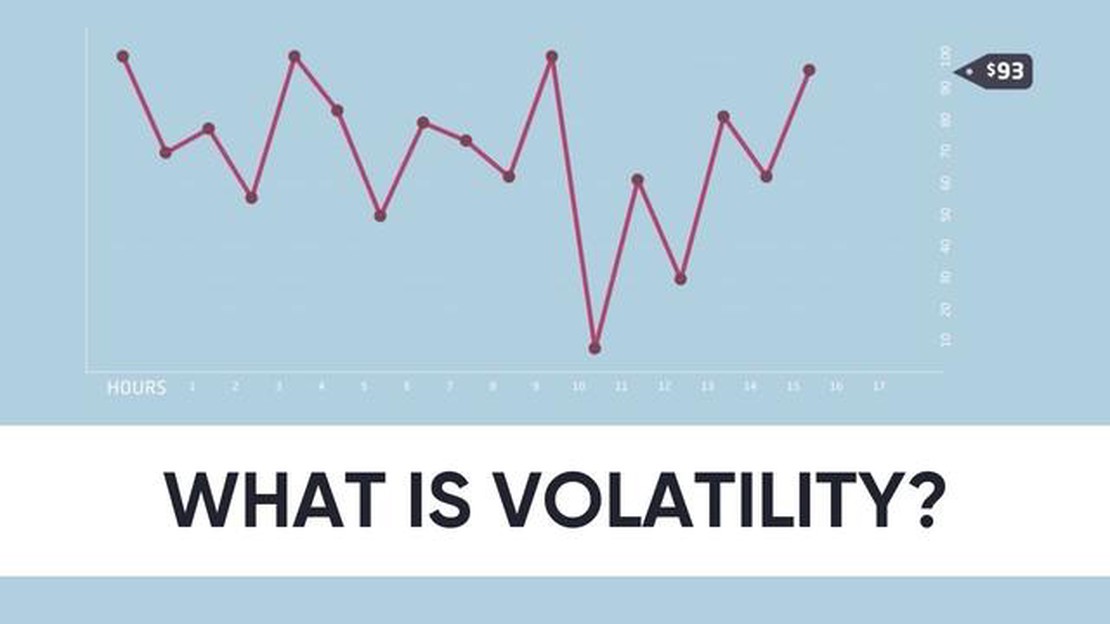
Understanding Volatility in Forex Trading Volatility is a key concept in the forex market, and understanding it is crucial for any trader looking to …
Read Article


