


Understanding Open Interest in CME: A Comprehensive Guide
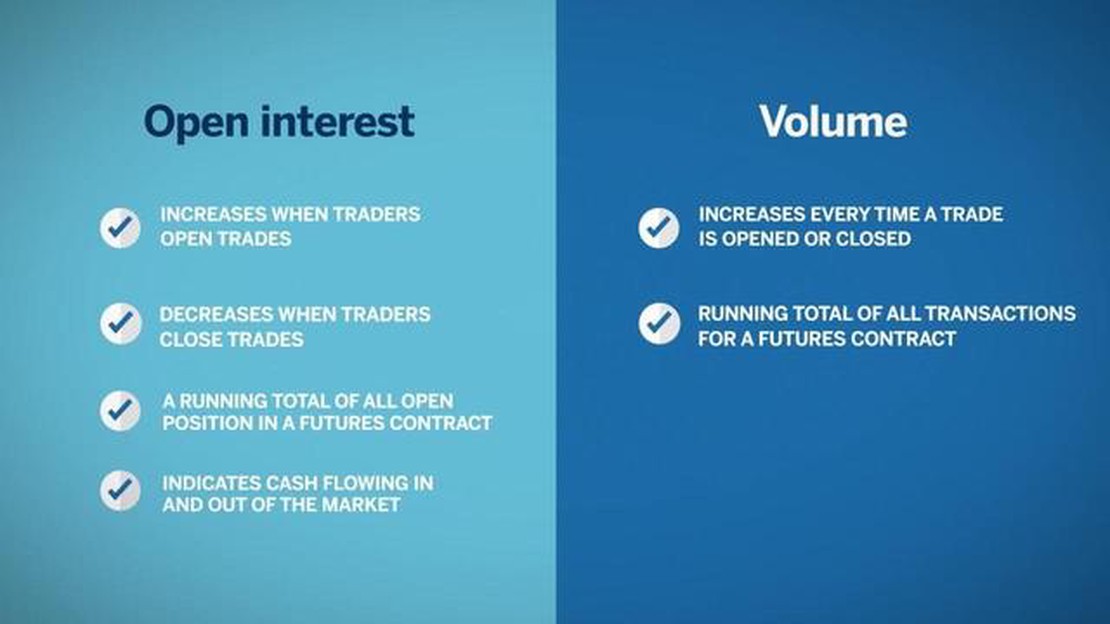
Understanding Open Interest in CME Market Open interest is a key concept in the world of commodities and derivatives trading. It represents the total …
Read Article

When it comes to trading in the financial markets, there are several key metrics that traders use to analyze and make decisions. These metrics provide valuable insights into the behavior of the market and can help traders identify potential opportunities and risks. One of the most commonly used metrics is volume, which refers to the number of shares or contracts traded during a given period. High volume can indicate increased interest and participation in a particular security, while low volume may suggest a lack of enthusiasm.
Another important metric in trading is volatility, which measures the degree of price fluctuations in a security or market. Volatility can be a double-edged sword, as it can provide opportunities for high returns but also increase risks. Traders often use indicators such as the average true range (ATR) to gauge volatility and adjust their strategies accordingly.
Moving averages are another key metric used in trading. These indicators smooth out price data over a specified period and help traders identify trends and potential support and resistance levels. The most commonly used moving averages include the simple moving average (SMA) and the exponential moving average (EMA). These averages can help traders determine entry and exit points and set stop loss and take profit levels.
In addition to volume, volatility, and moving averages, there are many other metrics that traders use to analyze the markets. These include relative strength index (RSI), average directional index (ADX), and Bollinger Bands, among others. Each metric provides a different perspective on the market and can be used in conjunction with others to create a comprehensive trading strategy.
It’s important for traders to understand and utilize these key metrics in order to make informed decisions and increase the likelihood of success in the markets. However, it’s equally important to remember that no metric or combination of metrics can guarantee profitability. Trading involves risks, and careful analysis and risk management are crucial for long-term success.
In conclusion, key metrics such as volume, volatility, and moving averages play a critical role in trading. They provide valuable insights into market behavior and can help traders identify potential opportunities and risks. By using these metrics in conjunction with other indicators, traders can develop a comprehensive trading strategy and increase their chances of success. However, it’s important to remember that no metric is foolproof, and risk management should always be a top priority.
Trading involves the buying and selling of financial instruments, such as stocks, bonds, and commodities, with the goal of making a profit. Traders use a variety of metrics to analyze and predict market trends, ultimately determining whether to buy or sell a particular asset.
One key metric used in trading is volume. Volume refers to the number of shares or contracts traded in a particular security or market within a specific time period. High volume often indicates increased market interest and liquidity, while low volume can suggest a lack of interest or participation.
Another important metric is moving averages. Moving averages are calculated by taking the average price of an asset over a certain period of time. Traders use moving averages to identify trends and determine potential entry or exit points. For example, a trader may use a 50-day moving average to signal a buying opportunity if the asset’s price crosses above the moving average line.
Volatility is also a key metric in trading. Volatility measures the rate at which an asset’s price fluctuates over a certain time period. High volatility can provide trading opportunities for those who can handle the risk, while low volatility may indicate a market that is relatively stable.
Other common metrics used in trading include relative strength index (RSI), which measures the strength and speed of a price movement, and average true range (ATR), which indicates the average price range of an asset over a specific period of time.
Read Also: The Ultimate Guide to Finding the Best Swing Trading Strategy
Volume is a key metric used in trading to measure the number of shares or contracts that are traded within a specified period of time. It is an important indicator of the level of interest and activity in a particular security or market.
Volume is often used in conjunction with other technical indicators to analyze price movements and predict future trends. For example, an increase in volume during a price uptrend can indicate strong buying pressure and suggest that the price may continue to rise. On the other hand, a decrease in volume during an uptrend may suggest a lack of buying interest and a potential reversal in the price.
Read Also: How to Create a Bollinger Band in Python: A Step-by-Step Guide
Traders also pay attention to volume patterns, such as volume spikes or volume divergences. A volume spike occurs when there is a sudden and significant increase in trading volume, which could indicate a significant news event or a change in market sentiment. A volume divergence occurs when the price moves in one direction while volume moves in the opposite direction, which could suggest a potential trend reversal.
Volume can also be used as a confirmation tool. For example, if a security is breaking out of a resistance level on high volume, it may indicate a stronger move and increase the likelihood of a successful breakout. Conversely, if a security is breaking out on low volume, it may suggest a false breakout and increase the risk of a failed trade.
Overall, volume is an important trading metric that provides valuable insights into the strength and direction of price movements. Traders use volume analysis to make more informed trading decisions and improve their overall trading performance.
Trading volume refers to the number of shares or contracts traded in the market during a given period of time. It is an important metric in trading because it provides insights into the liquidity of a particular security or market. High trading volume is often associated with increased price volatility and can indicate strong market interest in a particular security.
A moving average is a calculation that takes the average price of a security over a specific period of time. It is calculated by adding up the prices over the given time period and dividing by the number of periods. Moving averages are useful in trading because they can help identify trends and potential support and resistance levels. Traders often use moving averages to generate buy and sell signals.
The main difference between a simple moving average (SMA) and an exponential moving average (EMA) is the weightage given to each data point. In a SMA, all data points are given equal weightage, while in an EMA, more weightage is given to recent data points. This means that an EMA will react more quickly to price changes compared to a SMA. Traders often use EMAs for short-term trading strategies, while SMAs are more commonly used for longer-term analysis.

The relative strength index (RSI) is a momentum oscillator that measures the speed and change of price movements. It is used to identify overbought and oversold levels in a security. A reading above 70 is typically considered overbought and suggests that the security may be due for a pullback. Conversely, a reading below 30 is considered oversold and suggests that the security may be due for a bounce. Traders often use the RSI to help determine entry and exit points.
The average true range (ATR) is a measure of market volatility. It takes into account the daily price range of a security, including any gaps or price jumps. Traders can use the ATR to determine the potential profit targets and stop-loss levels for their trades. A higher ATR indicates greater volatility, while a lower ATR indicates lower volatility. By incorporating the ATR into their trading strategies, traders can adjust their positions and risk management accordingly.
Key metrics used in trading are various indicators and measurements that traders rely on to make informed decisions. These metrics include volume, moving averages, relative strength index (RSI), MACD, and others.
Volume is a key metric used in trading to measure the number of shares or contracts traded within a given time period. It provides insight into the level of market activity and liquidity. High volume often indicates investor interest and can be seen as a confirmation of price movements.

Understanding Open Interest in CME Market Open interest is a key concept in the world of commodities and derivatives trading. It represents the total …
Read Article
What is Kiwi in forex trading? The New Zealand dollar, also known as the Kiwi, is the official currency of New Zealand and is widely used in …
Read Article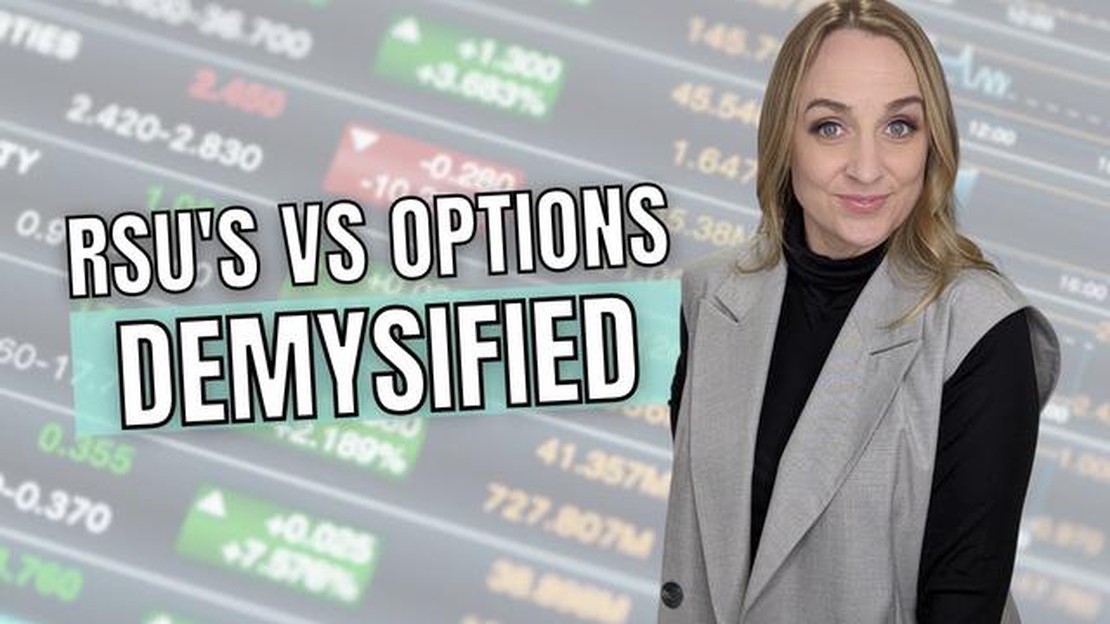
Understanding the Difference between RSU and Vested Stock Options When it comes to compensation packages offered by employers, it’s important for …
Read Article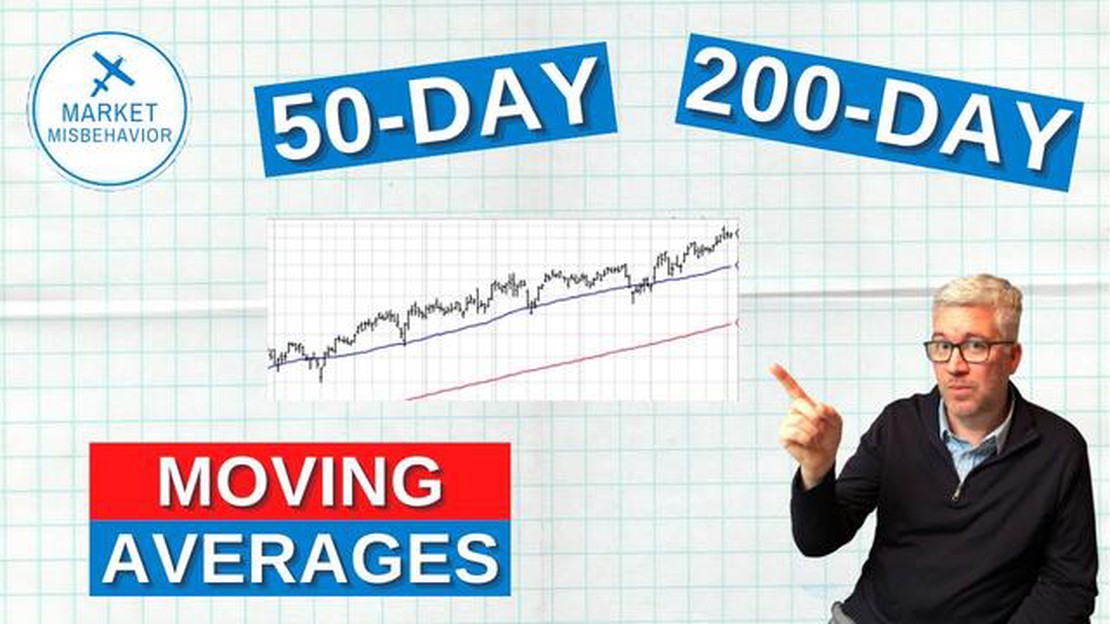
What is the significance of the meta 200-day moving average? The Meta 200-Day Moving Average is a key technical analysis tool that is widely used by …
Read Article
Can I Trade Options in the Forex Market? Foreign exchange, also known as Forex, is a decentralized global market where currencies are traded. It is …
Read Article
Understanding the Spread in Futures Trading The spread plays a crucial role in futures trading and understanding it is key to navigating the financial …
Read Article


