On-balance volume (OBV) is a popular technical analysis indicator used by traders to measure the strength of buying and selling pressure in the market. It is based on the theory that volume precedes price movement, and therefore can provide valuable insights into future price trends. Traders often rely on OBV to confirm the validity of a price trend, identify potential reversals, and generate buy or sell signals.
Table Of Contents
The premise behind OBV is simple: when volume increases on days when the price of an asset closes higher, the OBV increases; conversely, when volume increases on days when the price closes lower, the OBV decreases. This calculation creates a cumulative line that moves up and down, reflecting the net buying or selling pressure in the market.
Proponents of OBV argue that it can be a reliable indicator for trading for several reasons. Firstly, it provides a way to confirm the strength of a price trend. If the OBV line is moving upward and in the same direction as the price, it suggests a strong trend and increased buying pressure. On the other hand, if the OBV line is declining while the price is rising, it may indicate a weakening trend and potential reversal.
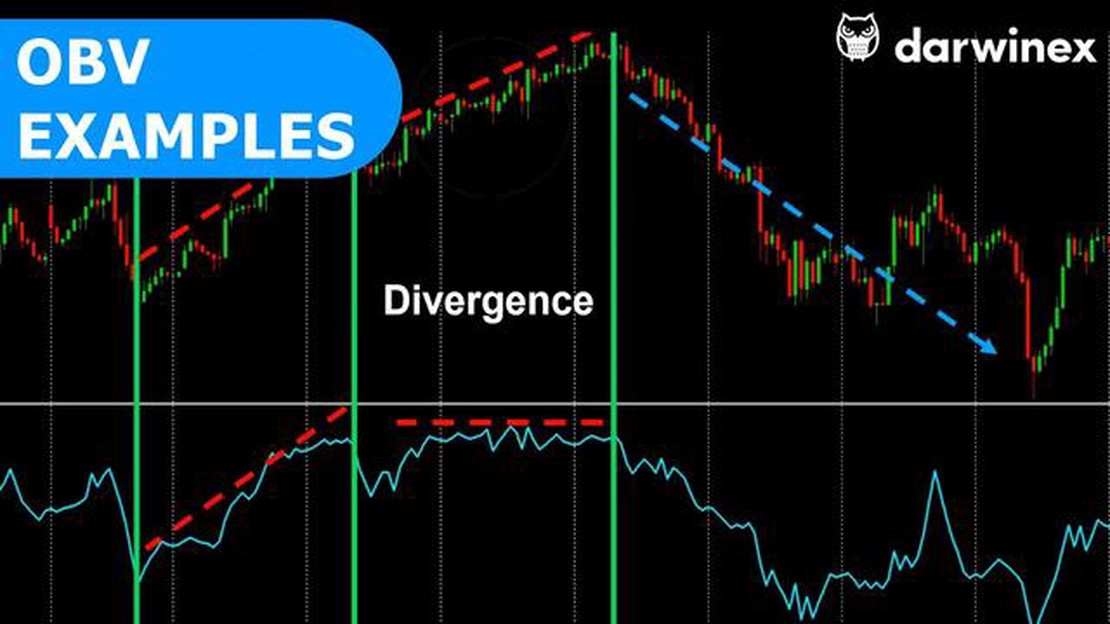
Additionally, OBV can help traders identify divergences between the price and the indicator. For example, if the price is making higher highs while the OBV line is making lower highs, it may suggest that the price trend is losing steam and a reversal could be imminent. Traders often use such divergences as a signal to enter or exit trades.
However, it is important to note that no indicator is foolproof, and OBV is no exception. Like any technical analysis tool, it has its limitations and is not always accurate in predicting future price movements. Traders should use it in conjunction with other indicators and analysis methods to make well-informed trading decisions.
What is on-balance volume and how it works
On-balance volume (OBV) is a technical indicator that measures the buying and selling pressure of a security. It is based on the concept that volume precedes price movement, and is used to confirm the strength of a trend.
OBV works by calculating cumulative volume based on positive and negative changes in price. It adds volume on days when the price closes higher than the previous day, and subtracts volume on days when the price closes lower. The cumulative total is then plotted on a graph, creating the OBV line.
For example, if the current day’s closing price is higher than the previous day’s closing price, the volume for the current day is added to the cumulative total. Conversely, if the current day’s closing price is lower than the previous day’s closing price, the volume for the current day is subtracted from the cumulative total.
Traders use OBV to identify trend reversals and confirm the strength of a current trend. If the OBV line is sloping upward, it indicates that buying pressure is increasing and the price is likely to continue rising. Conversely, if the OBV line is sloping downward, it indicates that selling pressure is increasing and the price is likely to continue falling.
OBV can also be used to identify divergence between price and volume, which can signal potential trend reversals. For example, if the price is making higher highs while the OBV line is making lower highs, it could indicate that the buying pressure is weakening and a reversal may be imminent.
However, it’s important to note that OBV is not a standalone indicator and should be used in conjunction with other technical analysis tools to make trading decisions. It is also not foolproof and can produce false signals, especially in choppy or low-volume markets.
Overall, OBV can provide valuable insights into the buying and selling pressure of a security, but it should be used as part of a comprehensive trading strategy rather than relied upon as a sole indicator.
Advantages and disadvantages of using on-balance volume as a trading indicator
Advantages:
Simple and easy to understand: On-balance volume (OBV) is a straightforward indicator that provides traders with a visual representation of the relationship between the volume of a security and its price movement. It is calculated by adding the trading volume to a cumulative total when the price moves up and subtracting the volume when the price moves down. This simplicity makes it accessible to traders of all levels of experience.
Confirmation of price trends: OBV is commonly used as a tool to confirm price trends. When the OBV line is moving in the same direction as the price, it suggests that the buying or selling pressure is in line with the price movement, providing traders with added confidence in the trend.
3. Early identification of trend reversals: OBV can also be used to identify potential trend reversals. Divergences between the OBV line and the price often signal a shift in buying or selling pressure, which can precede a change in trend. Traders can use these divergences to anticipate trend reversals and adjust their trading strategies accordingly.
Disadvantages:
Not suitable for all market conditions: While OBV can be an effective indicator in trending markets, it may not work well in choppy or volatile markets. During such periods, the OBV line may produce false signals or fail to provide clear indications of the market direction.
Limited to volume-based analysis: OBV is primarily based on trading volume, which may not always be a reliable indicator of market sentiment or future price movements. It does not take into account other factors such as investor sentiment, market news, or fundamental analysis, which can also influence market trends.
3. Subject to manipulation: Like any volume-based indicator, OBV is susceptible to manipulation. In thinly traded markets or situations where large traders or institutions can influence the volume, the accuracy of OBV signals may be compromised.
4. Requires additional analysis: While OBV can provide valuable insights into price trends and reversals, it is not a standalone indicator. Traders should use OBV in conjunction with other technical indicators or chart patterns to enhance their trading decisions.
Overall, on-balance volume can be a useful tool for traders, but it should be used in conjunction with other indicators and not solely relied upon for trading decisions. Traders should also consider the specific market conditions and context in which they are using OBV to maximize its effectiveness.
FAQ:
What is on-balance volume (OBV) and how does it work?
On-balance volume (OBV) is a technical analysis indicator that measures the positive and negative volume flow in a security. It works by adding the volume on up days and subtracting the volume on down days. The theory is that volume precedes price movements, so by analyzing the volume flow, traders can predict the direction of future price movements.
How reliable is the on-balance volume indicator for trading?
The reliability of the on-balance volume indicator for trading depends on various factors. While it can provide valuable insights into the volume and price relationship, it is not a standalone indicator for making trading decisions. Traders often use on-balance volume in conjunction with other technical indicators for confirmation. Additionally, it is important to consider the overall market conditions and trends when analyzing the OBV.
Can the on-balance volume indicator be used for day trading?
Yes, the on-balance volume indicator can be used for day trading. Traders can look for divergences between the OBV and price movements to identify potential trading opportunities. For example, if the price of a security is rising, but the OBV is declining, it could be a sign of a potential reversal. However, it is important to use the OBV in conjunction with other indicators and to consider other factors, such as market volatility and news events, when day trading.
Are there any limitations or drawbacks to using the on-balance volume indicator?
Yes, there are some limitations and drawbacks to using the on-balance volume indicator. One limitation is that it is based solely on volume and does not take into account other factors that can influence price movements. Additionally, it can be prone to false signals, especially in markets with low trading volumes or during periods of high volatility. Traders should always use the OBV in conjunction with other indicators and consider the overall market conditions when making trading decisions.
What are some potential trading strategies that incorporate the on-balance volume indicator?
There are several potential trading strategies that incorporate the on-balance volume indicator. One strategy is to look for divergences between the OBV and price movements. For example, if the price is making a new high, but the OBV is not, it could be a sign of a potential reversal. Another strategy is to use the OBV as a trend confirmation indicator. If the OBV is rising along with the price, it can be a confirmation of an uptrend. Conversely, if the OBV is declining along with the price, it can be a confirmation of a downtrend. These are just a few examples, and traders can develop their own strategies based on their trading style and preferences.
What is on-balance volume (OBV)?
On-balance volume (OBV) is a technical indicator used in technical analysis to measure buying and selling pressure. It is based on the concept that volume should confirm price movements. OBV adds a certain amount of the day’s volume to a running total if the price closes higher, or subtracts the volume if the price closes lower. The idea behind OBV is that volume precedes price movement, and by analyzing the volume of an asset, traders can gain insights into potential price reversals or continuations.
Understanding Simple Moving Average Filters In signal processing, one common task is to eliminate noise or fluctuations from a signal while preserving …
Understanding the Functions of Stock Options Stock options are a popular form of compensation and investment for many individuals and companies. They …